

Government budget by country
Encyclopedia
Government budget
A government budget is a legal document that is often passed by the legislature, and approved by the chief executive-or president. For example, only certain types of revenue may be imposed and collected...
. The countries are ranked by budget revenues. The data is taken mainly from CIA World Factbook.. In the United States the federal budget represents only 55% of total public spending amounting to 6 trillion USD in 2011.
Estimating budgets
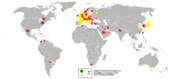
Note: For some federations like the Brazil, Mexico, and the United States, only the federal budget is shown. For most other countries the total budget is shown. Although Germany is a federation the statistics for Germany represent total general government spending. In the United States federal spending represents only 55% of total public spending (6 trillion USD in 2011.Nations
| Rank | Country | Revenues (million USD) | Expenditures (million USD) | Deficit/surplus (million USD) | Date |
|---|---|---|---|---|---|
| 1 |  United States (details United States (detailsUnited States federal budget The Budget of the United States Government is the President's proposal to the U.S. Congress which recommends funding levels for the next fiscal year, beginning October 1. Congressional decisions are governed by rules and legislation regarding the federal budget process... ) |
2,092,000 | 3,397,000 | -1,305,000 | 2010 est. |
| * | United States (United States State & local budget) |
2,413,384 | 2,966,614 | ||
| 2009 | |||||
| 2 |  Japan Japan |
1,839,000 | 2,252,000 | -413,000 | 2009 est. |
| 3 |  Germany Germany |
1,398,000 | 1,540,000 | -142,000 | 2009 est. |
| 4 |  Early Modern France (details Early Modern France (detailsBudget of France The Budget of France, setting revenues and spending levels is set after approval of the national assembly and the senate. The french Constitution provides for a maximum of 70 days between the budget being proposed to parliament and it being approved... ) |
1,229,000.0 | 1,445,000.0 | -216,000.0 | 2009 est. |
| 5 |  Mainland China Mainland China |
1,149,000.0 | 1,270,000.0 | -121,000.0 | 2009 est. |
| 6 |  Italy Italy |
960,100.0 | 1,068,000.0 | -107,900.0 | 2009 est. |
| 7 |  United Kingdom (details United Kingdom (detailsUnited Kingdom budget The United Kingdom budget deals with HM Treasury budgeting the revenues gathered by Her Majesty's Revenue and Customs and expenditures of public sector departments, in compliance with government policy.Adjustment is achieved with the GDP deflator.... ) |
926,700.0 | 1,154,000.0 | -227,300.0 | 2009 est. |
| 8 |  Canada (details Canada (detailsCanadian federal budget In Canada, federal budgets are presented annually by the Government of Canada to identify planned government spending, expected government revenue, and forecast economic conditions for the upcoming year.... ) |
605,700.0 | 677,700.0 | -72,000.0 | 2009 est. |
| 9 |  Spain Spain |
503,100.0 | 633,300.0 | -130,200.0 | 2009 est. |
| 10 |  Brazil Brazil |
464,400.0 | 552,600.0 | -88,200.0 | 2009 est. |
| 11 |  Australia (details) Australia (details) |
396,100.0 | 426,500.0 | -30,400.0 | 2009 est. |
| 12 |  Netherlands Netherlands |
356,000.0 | 399,300.0 | -43,300.0 | 2009 est. |
| 13 |  Russia Russia |
262,100.0 | 341,100.0 | -80,000.0 | 2009 est. |
| 14 |  South Korea South Korea |
248,300.0 | 267,300.0 | -19,000.0 | 2009 est. |
| 15 |  Mexico Mexico |
237,000.0 | 267,000.0 | -30,000 | 2009 est. |
| 16 |  Sweden Sweden |
230,100.0 | 236,600.0 | -6,500.0 | 2009 est. |
| 17 |  Norway Norway |
226,800.0 | 187,300.0 | +39,500.0 | 2009 est. |
| 18 |  Belgium Belgium |
220,600.0 | 242,600.0 | -20,000.0 | 2008 est. |
| 19 |  Austria Austria |
198,600.0 | 203,000.0 | -4,400.0 | 2008 est. |
| 20 |  Denmark Denmark |
170,900.0 | 179,200.0 | -8,300.0 | 2008 est. |
| 20 |  Switzerland Switzerland |
178,500.0 | 179,500.0 | -1,000.0 | 2009 est. |
| 21 |  Turkey Turkey |
164,600.0 | 176,300.0 | -11,700.0 | 2008 est. |
| 22 |  India (details India (detailsUnion budget of India The Union Budget of India, referred to as the annual Financial Statement in Article 112 of the Constitution of India, is the annual budget of the Republic of India, presented each year on the last working day of February by the Finance Minister of India in Parliament... ) |
185,400.0 | 269,800.0 | -51,800.0 | 2010 est. |
| 23 |  Saudi Arabia Saudi Arabia |
134,700.0 | 146,700.0 | -12,000.0 | 2009 est. |
| 24 |  Finland Finland |
127,000.0 | 132,300.0 | -5,300.0 | 2009 |
| 25 |  Greece Greece |
132,400.0 | 143,800.0 | -11,400.0 | 2008 est. |
| 26 |  Poland Poland |
117,000.0 | 127,300.0 | -10,300.0 | 2008 est. |
| 27 |  Portugal Portugal |
108,600.0 | 114,700.0 | -6,100.0 | 2008 est. |
| 28 |  Iran Iran |
105,700.0 | 98,830.0 | 6,870.0 | 2010 est. |
| 31 |  Kuwait Kuwait |
72,300.0 | 47,530.0 | +24,770.0 | 2009 est. |
| 32 |  Venezuela Venezuela |
50,120.0 | 56,530.0 | -6,410.0 | 2010 est. |
| 33 |  Indonesia Indonesia |
119,500.0 | 132,900.0 | -13,400.0 | 2010 est. |
| 34 |  Czech Republic Czech Republic |
94,960.0 | 99,460.0 | -4,500.0 | 2008 est. |
| 35 |  Republic of Ireland Republic of Ireland |
93,840.0 | 110,800.0 | -16,960.0 | 2008 est. |
| 36 |  Argentina Argentina |
84,300.0 | 86,200.0 | -1,900.0 | 2009 est. |
| 37 |  South Africa South Africa |
83,850.0 | 83,300.0 | +550.0 | 2008 est. |
| 38 |  United Arab Emirates United Arab Emirates |
55,070.0 | 54,680.0 | +39.0 | 2009 est. |
| 39 |  Colombia Colombia |
76,420.0 | 78,490.0 | -2,070.0 | 2008 est. |
| 40 |  Hungary Hungary |
76,200.0 | 81,500.0 | -5,300.0 | 2008 est. |
| 41 |  Algeria Algeria |
63,080.0 | 75,760.0 | -12,680.0 | 2008 est. |
| 42 |  Israel Israel |
68,440.0 | 70,060.0 | -1,620.0 | 2008 est. |
| 43 |  Ukraine Ukraine |
65,020.0 | 68,480.0 | -3,460.0 | 2008 est. |
| 44 |  Kingdom of Romania Kingdom of Romania |
64,440.0 | 71,160.0 | -6,720.0 | 2008 est. |
| 45 |  Libya Libya |
34,190.0 | 34,730.0 | -580.0 | 2009 est. |
| 45 |  New Zealand New Zealand |
55,100.0 | 54,660.0 | +440.0 | 2008 est. |
| — |  Republic of China Republic of China |
50,910.0 | 54,700.0 | -3,790.0 | 2008 est. |
| 46 |  Chile Chile |
32,620.0 | 39,820.0 | -7,600.0 | 2009 est. |
| 47 |  Thailand Thailand |
45,300.0 | 55,760.0 | -10,460.0 | 2008 est. |
| 48 |  Slovakia Slovakia |
44,860.0 | 46,960.0 | -2,100.0 | 2008 est. |
| 49 |  Malaysia Malaysia |
44,320.0 | 55,010.0 | -10,690.0 | 2008 est. |
| 50 |  Iraq Iraq |
42,400.0 | 49,900.0 | -7,500.0 | FY08 est. |
| 51 |  Cuba Cuba |
41,060.0 | 43,330.0 | -2,270.0 | 2008 est. |
| 52 |  Egypt Egypt |
40,460.0 | 51,380.0 | -10,920.0 | 2008 est. |
| 53 |  Qatar Qatar |
36,840.0 | 28,280.0 | +8,560.0 | 2009 est. |
| 54 |  Peru Peru |
35,250.0 | 37,890.0 | -2,640.0 | 2009 est. |
| — |  Hong Kong Hong Kong |
36,620.0 | 38,890.0 | -2,270.0 | 2008 est. |
| 55 |  Kazakhstan Kazakhstan |
29,640.0 | 32,600.0 | -2,960.0 | 2008 est. |
| 56 |  Nigeria Nigeria |
29,490.0 | 30,610.0 | -1,120.0 | 2008 est. |
| 57 |  Singapore Singapore |
21,290.0 | 24,140.0 | -2,850.0 | 2009 est. |
| 58 |  Angola Angola |
34,020.0 | 32,470.0 | -45.0 | 2008 est. |
| 59 |  Philippines Philippines |
26,750.0 | 28,200.0 | -1,450.0 | 2008 est. |
| 60 |  Morocco Morocco |
26,090.0 | 28,410.0 | -2,320.0 | 2008 est. |
| 61 |  Belarus Belarus |
25,230.0 | 26,050.0 | -820.0 | 2008 est. |
| 62 |  Independent State of Croatia Independent State of Croatia |
23,710.0 | 23,460.0 | +250.0 | 2008 est. |
| 63 |  Slovenia Slovenia |
23,160.0 | 22,930.0 | +230.0 | 2008 est. |
| 64 |  Vietnam Vietnam |
22,390.0 | 24,190.0 | -1,800.0 | 2008 est. |
| 65 |  Luxembourg Luxembourg |
22,250.0 | 22,080.0 | +170.0 | 2008 est. |
| 66 |  Pakistan Pakistan |
22,140.0 | 32,090.0 | -9,950.0 | 2008 est. |
| 67 |  Kingdom of Bulgaria Kingdom of Bulgaria |
17,820.0 | 18,200.0 | -380.0 | 2009 |
| 68 |  Ecuador Ecuador |
16,840.0 | 18,900.0 | -2,060.0 | 2009 est. |
| 69 |  Lithuania Lithuania |
15,400.0 | 15,860.0 | -460.0 | 2008 est. |
| 70 |  Oman Oman |
14,600.0 | 16,700.0 | -2,100.0 | 2009 est. |
| 71 |  Azerbaijan Azerbaijan |
14,510.0 | 15,660.0 | -1,150.0 | 2008 est. |
| 72 |  Latvia Latvia |
12,330.0 | 12,840.0 | -510.0 | 2008 est. |
| 73 |  Sudan Sudan |
11,840.0 | 12,950.0 | -1,110.0 | 2008 est. |
| 74 |  Cyprus Cyprus |
11,330.0 | 11,200.0 | +130.0 | 2008 est. |
| 75 |  Syria Syria |
10,900.0 | 13,770.0 | -2,870.0 | 2008 est. |
| 76 |  Tunisia Tunisia |
9,652.0 | 11,030.0 | -1,378.0 | 2008 est. |
| 77 |  Serbia Serbia |
9,600.0 | 9,800.0 | -200.0 | 2007 est. |
| 78 |  Yemen Yemen |
9,097.0 | 10,550.0 | -1,453.0 | 2008 est. |
| 79 |  Estonia Estonia |
8,920.0 | 9,091.0 | -171.0 | 2008 est. |
| 80 |  Bangladesh Bangladesh |
8,831.0 | 12,540.0 | -3,709.0 | 2008 est. |
| 81 |  Bosnia and Herzegovina Bosnia and Herzegovina |
8,607.0 | 8,962.0 | -355.0 | 2008 est. |
| 82 |  Trinidad and Tobago Trinidad and Tobago |
8,317.0 | 8,311.0 | +6.0 | 2008 est. |
| 83 |  Uruguay Uruguay |
8,204.0 | 8,526.0 | -322.0 | 2008 est. |
| 84 |  Bolivia Bolivia |
8,044.0 | 7,341.0 | +703.0 | 2008 est. |
| 85 |  Uzbekistan Uzbekistan |
8,005.0 | 8,127.0 | -122.0 | 2008 est. |
| 86 |  Dominican Republic Dominican Republic |
7,947.0 | 9,069.0 | -1,122.0 | 2008 est. |
| 87 |  Sri Lanka Sri Lanka |
7,800.0 | 11,000.0 | -3,200.0 | 2009 est. |
| 88 |  Iceland Iceland |
7,582.0 | 7,159.0 | +423.0 | 2008 est. |
| 89 |  Bahrain Bahrain |
5,590.0 | 5,777.0 | -187.0 | 2009 est. |
| 90 |  Equatorial Guinea Equatorial Guinea |
5,523.0 | 5,998.0 | -475.0 | 2009 est. |
| 91 |  Lebanon Lebanon |
7,000.0 | 10,000.0 | -3,000.0 | 2008 est. |
| 92 |  Brunei Brunei |
6,889.0 | 4,000.0 | +2,889.0 | 2008 est. |
| — |  Puerto Rico Puerto Rico |
6,700.0 | 9,600.0 | -2,900.0 | FY99/00 |
| 93 |  Kenya Kenya |
6,617.0 | 8,196.0 | -1,579.0 | 2008 est. |
| — |  Macau Macau |
6,200.0 | 2,900.0 | +3,300.0 | 2008 |
| 94 |  Panama Panama |
6,090.0 | 6,000.0 | +90.0 | 2008 est. |
| 95 |  Jordan Jordan |
5,999.0 | 7,870.0 | -1,871.0 | 2008 est. |
| 96 |  Cameroon Cameroon |
4,014.0 | 4,128.0 | -114.0 | 2009 est. |
| 97 |  Republic of the Congo Republic of the Congo |
5,363.0 | 2,758.0 | +2,605.0 | 2008 est. |
| 98 |  Guatemala Guatemala |
4,944.0 | 5,647.0 | -703.0 | 2008 est. |
| 99 |  Côte d'Ivoire Côte d'Ivoire |
4,725.0 | 5,082.0 | -357.0 | 2008 est. |
| 100 |  Costa Rica Costa Rica |
4,604.0 | 4,552.0 | +52.0 | 2008 est. |
| 101 |  Ethiopia Ethiopia |
4,586.0 | 5,729.0 | -1,143.0 | 2008 est. |
| 102 |  Botswana Botswana |
4,556.0 | 4,127.0 | +429.0 | 2008 est. |
| 103 |  Gabon Gabon |
2,650.0 | 2,540.0 | +110.0 | 2009 est. |
| 104 |  Tanzania Tanzania |
4,216.0 | 4,658.0 | -442.0 | 2008 est. |
| 105 |  Jamaica Jamaica |
4,166.0 | 4,838.0 | -672.0 | 2008 est. |
| 106 |  Ghana Ghana |
4,021.0 | 5,521.0 | -1,500.0 | 2008 est. |
| 107 |  El Salvador El Salvador |
3,928.0 | 4,226.0 | -298.0 | 2008 est. |
| 108 |  Georgia (country) Georgia (country) |
3,778.0 | 4,182.0 | -404.0 | 2008 est. |
| 109 |  Zambia Zambia |
3,777.0 | 4,104.0 | -327.0 | 2008 est. |
| 110 |  Albania Albania |
3,771.0 | 4,538.0 | -767.0 | 2008 est. |
| 111 |  Malta Malta |
3,457.0 | 3,653.0 | -196.0 | 2008 est. |
| 112 |  Senegal Senegal |
3,141.0 | 3,799.0 | -658.0 | 2008 est. |
| 113 |  Papua New Guinea Papua New Guinea |
3,098.0 | 2,949.0 | +149.0 | 2008 est. |
| 114 |  Paraguay Paraguay |
2,939.0 | 2,866.0 | +73.0 | 2008 est. |
| 115 |  Republic of Macedonia Republic of Macedonia |
2,889.0 | 2,985.0 | -96.0 | 2008 est. |
| 116 |  North Korea North Korea |
2,880.0 | 2,980.0 | -100.0 | 2005 |
| 117 |  Mozambique Mozambique |
2,786.0 | 3,108.0 | -322.0 | 2008 est. |
| 118 |  Uganda Uganda |
2,720.0 | 3,050.0 | -330.0 | 2008 est. |
| 119 |  Namibia Namibia |
2,668.0 | 2,896.0 | -228.0 | 2008 est. |
| 120 |  Honduras Honduras |
2,628.0 | 3,183.0 | -555.0 | 2008 est. |
| 121 |  Armenia Armenia |
2,438.0 | 2,696.0 | -258.0 | 2008 est. |
| 122 |  Chad Chad |
2,142.0 | 2,125.0 | +17.0 | 2008 est. |
| 123 |  Moldova Moldova |
1,950.0 | 2,010.0 | -60.0 | 2008 |
| 124 |  Mauritius Mauritius |
1,866.0 | 2,243.0 | -377.0 | 2008 est. |
| 125 |  Burkina Faso Burkina Faso |
1,799.0 | 2,337.0 | -538.0 | 2008 est. |
| 126 |  Mongolia Mongolia |
1,710.0 | 1,950.0 | -240.0 | 2008 |
| 127 |  Nepal Nepal |
1,700.0 | 2,300.0 | -600.0 | FY08 |
| 128 |  Madagascar Madagascar |
1,688.0 | 2,066.0 | -378.0 | 2008 est. |
| 129 |  Mali Mali |
1,500.0 | 1,800.0 | -300.0 | 2006 est. |
| 130 |  Benin Benin |
1,436.0 | 1,729.0 | -293.0 | 2008 est. |
| 131 |  Turkmenistan Turkmenistan |
1,393.0 | 1,420.0 | -27.0 | 2008 est. |
| 132 |  Fiji Fiji |
1,363.0 | 1,376.0 | -13.0 | 2006 |
| — |  Greenland Greenland |
1,360.0 | 1,270.0 | +90.0 | 2005 |
| 133 |  Tajikistan Tajikistan |
1,280.0 | 1,300.0 | -20.0 | 2008 est. |
| 134 |  Nicaragua Nicaragua |
1,271.0 | 1,593.0 | -322.0 | 2008 est. |
| 135 |  Cambodia Cambodia |
1,264.0 | 1,478.0 | -214.0 | 2008 est. |
| 136 |  Malawi Malawi |
1,227.0 | 1,337.0 | -110.0 | 2008 est. |
| 137 |  Swaziland Swaziland |
1,215.0 | 1,155.0 | +60.0 | 2008 est. |
| — |  Republic of Kosovo Republic of Kosovo |
1,190.0 | 1,220.0 | -30.0 | 2007 est. |
| 138 |  Kyrgyzstan Kyrgyzstan |
1,170.0 | 1,192.0 | -22.0 | 2008 est. |
| — |  West Bank West Bank |
1,149.0 | 2,310.0 | -1,161.0 | 2006 |
| — |  Gaza Strip Gaza Strip |
1,149.0 | 2,310.0 | -1,161.0 | 2006 |
| 139 |  The Bahamas The Bahamas |
1,030.0 | 1,030.0 | +0.0 | FY04/05 |
| — |  New Caledonia New Caledonia |
996.0 | 1,072.0 | -76.0 | 2001 est. |
| 140 |  Myanmar Myanmar |
983.6 | 1,775.0 | -791.4 | 2008 est. |
| — |  Isle of Man Isle of Man |
965.0 | 943.0 | +22.0 | FY05/06 est. |
| 141 |  Rwanda Rwanda |
902.2 | 1,032.0 | -129.8 | 2008 est. |
| 142 |  Afghanistan Afghanistan |
890.0 | 2,700.0 | -1,810.0 | 2007 est. |
| — |  French Polynesia French Polynesia |
865.0 | 644.1 | +220.9 | 1999 |
| 143 |  Monaco Monaco |
863.0 | 920.6 | -57.6 | 2005 est. |
| 144 |  Barbados Barbados |
847.0 | 886.0 | -39.0 | 2000 est. |
| — |  United States Virgin Islands United States Virgin Islands |
837.0 | 837.0 | +0.0 | FY08/09 |
| — |  Jersey Jersey |
829.0 | 851.0 | -22.0 | 2005 |
| 145 |  Haiti Haiti |
820.6 | 965.2 | -144.6 | 2008 est. |
| 146 |  Laos Laos |
809.6 | 954.0 | -144.4 | 2008 est. |
| 147 |  Mauritania Mauritania |
770.0 | 770.0 | +0.0 | 2007 est. |
| 148 |  Maldives Maldives |
762.0 | 884.0 | -122.0 | 2008 est. |
| — |  Netherlands Antilles Netherlands Antilles |
757.9 | 949.5 | -191.6 | 2004 |
| — |  Bermuda Bermuda |
738.0 | 665.0 | +73.0 | FY04/05 |
| 149 |  East Timor East Timor |
733.0 | 309.0 | +424.0 | FY06/07 est. |
| 150 |  Democratic Republic of the Congo Democratic Republic of the Congo |
700.0 | 2,000.0 | -1,300.0 | 2006 est. |
| 151 |  San Marino San Marino |
690.6 | 652.9 | +37.7 | 2006 |
| — |  Faroe Islands Faroe Islands |
588.0 | 623.0 | -35.0 | 2005 |
| — |  Guernsey Guernsey |
563.6 | 530.9 | +32.7 | 2005 |
| 152 |  Togo Togo |
551.5 | 620.1 | -68.6 | 2008 est. |
| 153 |  Cape Verde Cape Verde |
525.4 | 585.3 | -59.9 | 2008 est. |
| 154 |  Lesotho Lesotho |
523.0 | 479.5 | +43.5 | 2008 est. |
| — |  Aruba Aruba |
507.9 | 577.9 | -70.0 | 2005 est. |
| 155 |  Andorra Andorra |
496.9 | 496.8 | +0.1 | 2007 |
| 156 |  Guyana Guyana |
463.7 | 536.0 | -72.3 | 2008 est. |
| — |  Gibraltar Gibraltar |
455.1 | 423.6 | +31.5 | 2005 est. |
| 157 |  Liechtenstein Liechtenstein |
424.2 | 414.1 | +10.1 | 1998 est. |
| — |  Cayman Islands Cayman Islands |
423.8 | 392.6 | +31.2 | 2004 |
| — |  Mayotte Mayotte |
420.0 | 394.0 | +26.0 | 2005 |
| 158 |  Suriname Suriname |
392.6 | 425.9 | -33.3 | 2004 |
| 159 |  Belize Belize |
335.5 | 361.5 | -26.0 | 2008 est. |
| 160 |  Niger Niger |
320.0 | 320.0 | +0.0 | 2002 est. |
| — |  Guam Guam |
319.6 | 427.8 | -108.2 | 2002 est. |
| 161 |  Seychelles Seychelles |
318.1 | 324.6 | -6.5 | 2008 est. |
| 162 |  Guinea Guinea |
315.0 | 796.5 | -481.5 | 2008 est. |
| 163 |  Vatican City Vatican City |
310.0 | 307.0 | +3.0 | 2006 |
| 164 |  Burundi Burundi |
292.2 | 351.3 | -59.1 | 2008 est. |
| 165 |  Bhutan Bhutan |
272.0 | 350.0 | -78.0 | 2005 |
| 166 |  Central African Republic Central African Republic |
250.0 | 273.0 | -23.0 | 2007 est. |
| 167 |  Eritrea Eritrea |
234.5 | 523.1 | -288.6 | 2008 est. |
| — |  British Virgin Islands British Virgin Islands |
204.7 | 180.4 | +24.3 | 2004 |
| 168 |  The Gambia The Gambia |
194.3 | 228.8 | -34.5 | 2008 est. |
| — |  Northern Mariana Islands Northern Mariana Islands |
193.0 | 223.0 | -30.0 | FY01/02 est. |
| 169 |  Samoa Samoa |
171.3 | 78.1 | +93.2 | FY04/05 est. |
| 170 |  Federated States of Micronesia Federated States of Micronesia |
166.0 | 152.7 | +13.3 | FY07 est. |
| — |  American Samoa American Samoa |
155.4 | 183.6 | -28.2 | FY07 |
| 171 |  Saint Lucia Saint Lucia |
141.2 | 146.7 | -5.5 | 2000 est. |
| 172 |  Djibouti Djibouti |
135.0 | 182.0 | -47.0 | 1999 est. |
| 173 |  Antigua and Barbuda Antigua and Barbuda |
123.7 | 145.9 | -22.2 | 2000 est. |
| 174 |  Marshall Islands Marshall Islands |
123.3 | 1,213.0 | -1,089.7 | 2008 |
| 175 |  Palau Palau |
114.8 | 99.5 | +15.3 | 2008 est. |
| 176 |  Sierra Leone Sierra Leone |
96.0 | 351.0 | -255.0 | 2000 est. |
| 177 |  Saint Vincent and the Grenadines Saint Vincent and the Grenadines |
94.6 | 85.8 | +8.8 | 2000 est. |
| 178 |  Saint Kitts and Nevis Saint Kitts and Nevis |
89.7 | 128.2 | -38.5 | 2003 est. |
| 179 |  Grenada Grenada |
85.8 | 102.1 | -16.3 | 1997 |
| 180 |  Tonga Tonga |
80.48 | 109.8 | -29.32 | FY07/08 |
| 181 |  Vanuatu Vanuatu |
78.7 | 72.23 | +6.47 | 2005 |
| 182 |  Dominica Dominica |
73.9 | 84.4 | -10.5 | 2001 |
| — |  Cook Islands Cook Islands |
70.95 | 69.05 | +1.9 | FY05/06 |
| — |  Saint-Pierre and Miquelon Saint-Pierre and Miquelon |
70.0 | 60.0 | +10.0 | 1996 est. |
| — |  Falkland Islands Falkland Islands |
66.2 | 67.9 | -1.7 | FY98/99 est. |
| 183 |  Kiribati Kiribati |
55.52 | 59.71 | -4.19 | FY05 |
| 184 |  Solomon Islands Solomon Islands |
49.7 | 75.1 | -25.4 | 2003 |
| 185 |  São Tomé and Príncipe São Tomé and Príncipe |
47.65 | 51.48 | -3.83 | 2008 est. |
| — |  Turks and Caicos Islands Turks and Caicos Islands |
47.0 | 33.6 | +13.4 | 1997-98 est. |
| — |  Montserrat Montserrat |
31.4 | 31.6 | -0.2 | 1997 est. |
| — |  Anguilla Anguilla |
22.8 | 22.5 | +0.3 | 2000 est. |
| 186 |  Tuvalu Tuvalu |
21.54 | 23.05 | -1.51 | 2006 |
| — |  Niue Niue |
15.07 | 16.33 | -1.26 | FY0405 |
| 187 |  Nauru Nauru |
13.5 | 13.5 | +0.0 | 2005 |
| — |  Saint Helena Saint Helena |
12.33 | 30.28 | -17.95 | FY06/07 est. |
| — |  Norfolk Island Norfolk Island |
4.6 | 4.8 | -0.2 | FY99/00 |
| — |  Pitcairn Islands Pitcairn Islands |
0.746 | 1.028 | -0.282 | FY04/05 |
| — |  Tokelau Tokelau |
0.4308 | 2.8 | -2.3692 | 1987 est. |
| 188 |  Zimbabwe Zimbabwe |
2,700 | 2,200 | -500 | 2011 est. |
| — |  Wallis and Futuna Wallis and Futuna |
0.02973 | 0.03133 | -0.0016 | 2004 |