

Euler diagram
Encyclopedia
Diagram
A diagram is a two-dimensional geometric symbolic representation of information according to some visualization technique. Sometimes, the technique uses a three-dimensional visualization which is then projected onto the two-dimensional surface...
matic means of representing sets and their relationships. The first use of "Eulerian circles" is commonly attributed to Swiss mathematician Leonhard Euler
Leonhard Euler
Leonhard Euler was a pioneering Swiss mathematician and physicist. He made important discoveries in fields as diverse as infinitesimal calculus and graph theory. He also introduced much of the modern mathematical terminology and notation, particularly for mathematical analysis, such as the notion...
(1707–1783). They are closely related to Venn diagram
Venn diagram
Venn diagrams or set diagrams are diagrams that show all possible logical relations between a finite collection of sets . Venn diagrams were conceived around 1880 by John Venn...
s.
Venn and Euler diagrams were incorporated as part of instruction in set theory
Set theory
Set theory is the branch of mathematics that studies sets, which are collections of objects. Although any type of object can be collected into a set, set theory is applied most often to objects that are relevant to mathematics...
as part of the new math
New math
New Mathematics or New Math was a brief, dramatic change in the way mathematics was taught in American grade schools, and to a lesser extent in European countries, during the 1960s. The name is commonly given to a set of teaching practices introduced in the U.S...
movement in the 1960s. Since then, they have also been adopted by other curriculum fields such as reading.
Overview
Euler diagrams consist of simple closed curves (usually circles) in the plane that depict sets. The sizes or shapes of the curves are not important, the significance of the diagram is in how they overlap. The spatial relationships between the regions bounded by each curve (overlap, containment or neither) corresponds to set-theoretic relationships (intersectionIntersection (set theory)
In mathematics, the intersection of two sets A and B is the set that contains all elements of A that also belong to B , but no other elements....
, subset
Subset
In mathematics, especially in set theory, a set A is a subset of a set B if A is "contained" inside B. A and B may coincide. The relationship of one set being a subset of another is called inclusion or sometimes containment...
and disjointness).
Each Euler curve divides the plane into two regions or "zones": the interior, which symbolically represents the elements of the set, and the exterior, which represents all elements that are not members of the set. Curves whose interior zones do not intersect represent disjoint sets. Two curves whose interior zones intersect represent sets that have common elements; the zone inside both curves represents the set of elements common to both sets (the intersection
Intersection (set theory)
In mathematics, the intersection of two sets A and B is the set that contains all elements of A that also belong to B , but no other elements....
of the sets). A curve that is contained completely within the interior zone of another represents a subset
Subset
In mathematics, especially in set theory, a set A is a subset of a set B if A is "contained" inside B. A and B may coincide. The relationship of one set being a subset of another is called inclusion or sometimes containment...
of it.
Venn diagram
Venn diagram
Venn diagrams or set diagrams are diagrams that show all possible logical relations between a finite collection of sets . Venn diagrams were conceived around 1880 by John Venn...
s are a more restrictive form of Euler diagrams. A Venn diagram must contain all the possible zones of overlap between its curves, representing all combinations of inclusion/exclusion of its constituent sets, but in an Euler diagram some zones might be missing. Therefore there is only one Venn diagram representing the relationships between n sets, with 2n zones, but there may be many Euler diagrams. (An example is given below in the History section; in the top-right illustration the O and I diagrams are merely rotated; Venn stated that this difficulty in part led him to develop his diagrams).
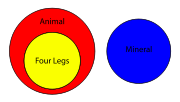
In a logical setting, one can use model theoretic semantics to interpret Euler diagrams, within a universe of discourse. In the examples above, the Euler diagram depicts that the sets Animal and Mineral are disjoint since the corresponding curves are disjoint, and also that the set Four Legs is a subset of the set of Animals. The Venn diagram, which uses the same categories of Animal, Mineral, and Four Legs, does not encapsulate these relationships. Traditionally the emptiness of a set in Venn diagrams is depicted by shading in the region. Euler diagrams represent emptiness either by shading or by the use of a missing region.
Often a set of well-formedness conditions are imposed; these are topological or geometric constraints imposed on the structure of the diagram. For example, connectedness of zones might be enforced, or concurrency of curves or multiple points might be banned, as might tangential intersection of curves. In the diagram to the right, examples of small Venn diagrams are transformed into Euler diagrams by sequences of transformations; some of the intermediate diagrams have concurrency of curves. However, this sort of transformation of a Venn diagram with shading into an Euler diagram without shading is not always possible. There are examples of Euler diagrams with 9 sets that are not drawable using simple closed curves without the creation of unwanted zones since they would have to have non-planar dual graphs.
History
As shown in the illustration to the right, William Rowan Hamilton (1805–1865) in his 1860 asserts that the original use of circles to "sensualize ... the abstractions of Logic" (p. 180) was not Leonhard Paul Euler (1707–1783) but rather Christian Weise (?–1708) in his Nucleus Logicoe Weisianoe that appeared in 1712 posthumously. He references Euler's Letters to a German Princess on different Matters of Physics and Philosophy1" [1Partie ii., Lettre XXXV., ed. Cournot. – ED.]In Hamilton's illustration the four forms of the syllogism
Syllogism
A syllogism is a kind of logical argument in which one proposition is inferred from two or more others of a certain form...
as symbolized by the drawings A, E, I and O are:
- A: The Universal Affirmative, Example: "All metals are elements".
- E: The Universal Negative, Example: "No metals are compound substances".
- I: The Particular Affirmative, Example: "Some metals are brittle".
- O: The Particular Negative, Example: "Some metals are not brittle".
In his 1881 Symbolic Logic Chapter V "Diagrammatic Representation", John Venn
John Venn
Donald A. Venn FRS , was a British logician and philosopher. He is famous for introducing the Venn diagram, which is used in many fields, including set theory, probability, logic, statistics, and computer science....
(1834–1923) comments on the remarkable prevalence of the Euler diagram:
- "...of the first sixty logical treatises, published during the last century or so, which were consulted for this purpose:-somewhat at random, as they happened to be most accessible :-it appeared that thirty four appealed to the aid of diagrams, nearly all of these making use of the Eulerian Scheme." (Footnote 1 page 100)
But nevertheless, he contended "the inapplicability of this scheme for the purposes of a really general Logic" (page 100) and in a footnote observed that "it fits in but badly even with the four propositions of the common Logic [the four forms of the syllogism] to which it is normally applied" (page 101). Venn ends his chapter with the observation that will be made in the examples below – that their use is based on practice and intuition, not on a strict algorithm
Algorithm
In mathematics and computer science, an algorithm is an effective method expressed as a finite list of well-defined instructions for calculating a function. Algorithms are used for calculation, data processing, and automated reasoning...
ic practice:
- “In fact ... those diagrams not only do not fit in with the ordinary scheme of propositions which they are employed to illustrate, but do not seem to have any recognized scheme of propositions to which they could be consistently affiliated.” (pp. 124–125)
Finally, in his Chapter XX HISTORIC NOTES Venn gets to a crucial criticism (italicized in the quote below); observe in Hamilton's illustration that the O (Particular Negative) and I (Particular Affirmative) are simply rotated:
- "We now come to Euler's well-known circles which were first described in his Lettres a une Princesse d'Allemagne (Letters 102–105). The weak point about these consists in the fact that they only illustrate in strictness the actual relations of classes to one another, rather than the imperfect knowledge of these relations which we may possess, or wish to convey, by means of the proposition. Accordingly they will not fit in with the propositions of common logic, but demand the constitution of a new group of appropriate elementary propositions.... This defect must have been noticed from the first in the case of the particular affirmative and negative, for the same diagram is commonly employed to stand for them both, which it does indifferently well". (italics added: page 424)
(Sandifer 2003 reports that Euler makes such observations too; Euler reports that his figure 45 (a simple intersection of two circles) has 4 different interpretations). Whatever the case, armed with these observations and criticisms, Venn then demonstrates (pp. 100–125) how he derived what has become known as his Venn diagrams from the "old-fashioned Euler diagrams". In particular he gives an example, shown on the left.
By 1914 Louis Couturat
Louis Couturat
Louis Couturat was a French logician, mathematician, philosopher, and linguist.-Life:Born in Ris-Orangis, Essonne, France, he was educated in philosophy and mathematics at the École Normale Supérieure...
(1868–1914) had labeled the terms as shown on the drawing on the right. Moreover, he had labeled the exterior region (shown as a'b'c') as well. He succinctly explains how to use the diagram – one must strike out the regions that are to vanish:
- "VENN'S method is translated in geometrical diagrams which represent all the constituents, so that, in order to obtain the result, we need only strike out (by shading) those which are made to vanish by the data of the problem." (italics added p. 73)
Given the Venn's assignments, then, the unshaded areas inside the circles can be summed to yield the following equation for Venn's example:
- "No Y is Z and ALL X is Y: therefore No X is Z" has the equation x'yz' + xyz' + x'y'z for the unshaded area inside the circles (but note that this is not entirely correct; see the next paragraph).
In Venn the 0th term, x'y'z', i.e. the background surrounding the circles, does not appear. Nowhere is it discussed or labeled, but Couturat corrects this in his drawing. The correct equation must include this unshaded area shown in boldface:
- "No Y is Z and ALL X is Y: therefore No X is Z" has the equation x'yz' + xyz' + x'y'z + x'y'z' .
In modern usage the Venn diagram includes a "box" that surrounds all the circles; this is called the universe of discourse or the domain of discourse
Domain of discourse
In the formal sciences, the domain of discourse, also called the universe of discourse , is the set of entities over which certain variables of interest in some formal treatment may range...
.
Couturat now observes that, in a direct algorithm
Algorithm
In mathematics and computer science, an algorithm is an effective method expressed as a finite list of well-defined instructions for calculating a function. Algorithms are used for calculation, data processing, and automated reasoning...
ic (formal, systematic) manner, one cannot derive reduced Boolean equations, nor does it show how to arrive at the conclusion "No X is Z". Couturat concluded that the process "has ... serious inconveniences as a method for solving logical problems":
- "It does not show how the data are exhibited by canceling certain constituents, nor does it show how to combine the remaining constituents so as to obtain the consequences sought. In short, it serves only to exhibit one single step in the argument, namely the equation of the problem; it dispenses neither with the previous steps, i. e., "throwing of the problem into an equation" and the transformation of the premises, nor with the subsequent steps, i. e., the combinations that lead to the various consequences. Hence it is of very little use, inasmuch as the constituents can be represented by algebraic symbols quite as well as by plane regions, and are much easier to deal with in this form."(p. 75)
Thus the matter would rest until 1952 when Maurice Karnaugh
Maurice Karnaugh
Maurice Karnaugh is an American physicist, famous for the Karnaugh map used in Boolean algebra.He studied mathematics and physics at City College of New York and transferred to Yale University to complete his B.Sc. , M.Sc. and Ph.D...
(1924– ) would adapt and expand a method proposed by Edward W. Veitch
Edward W. Veitch
Edward W. Veitch is an American computer scientist. He graduated from Harvard University in 1946 with a degree in Physics, followed by graduate degrees from Harvard in Physics and Applied Physics in 1948 and 1949 respectively...
; this work would rely on the truth table
Truth table
A truth table is a mathematical table used in logic—specifically in connection with Boolean algebra, boolean functions, and propositional calculus—to compute the functional values of logical expressions on each of their functional arguments, that is, on each combination of values taken by their...
method precisely defined in Emil Post's 1921 PhD thesis "Introduction to a general theory of elementary propositions" and the application of propositional logic to switching logic by (among others) Claude Shannon, George Stibitz
George Stibitz
George Robert Stibitz is internationally recognized as one of the fathers of the modern digital computer...
, and Alan Turing
Alan Turing
Alan Mathison Turing, OBE, FRS , was an English mathematician, logician, cryptanalyst, and computer scientist. He was highly influential in the development of computer science, providing a formalisation of the concepts of "algorithm" and "computation" with the Turing machine, which played a...
. For example, in chapter "Boolean Algebra" Hill and Peterson (1968, 1964) present sections 4.5ff "Set Theory as an Example of Boolean Algebra" and in it they present the Venn diagram with shading and all. They give examples of Venn diagrams to solve example switching-circuit problems, but end up with this statement:
-
- "For more than three variables, the basic illustrative form of the Venn diagram is inadequate. Extensions are possible, however, the most convenient of which is the Karnaugh map, to be discussed in Chapter 6." (p. 64)
In Chapter 6, section 6.4 "Karnaugh Map Representation of Boolean Functions" they begin with:
-
- "The Karnaugh map1 [1Karnaugh 1953] is one of the most powerful tools in the repertory of the logic designer. ... A Karnaugh map may be regarded either as a pictorial form of a truth table or as an extension of the Venn diagram." (pp. 103–104)
The history of Karnaugh's development of his "chart" or "map" method is obscure. Karnaugh in his 1953 referenced Veitch 1951, Veitch referenced Claude E. Shannon 1938 (essentially Shannon's Master's thesis at M.I.T.), and Shannon in turn referenced, among other authors of logic texts, Couturat 1914. In Veitch's method the variables are arranged in a rectangle or square; as described in Karnaugh map
Karnaugh map
The Karnaugh map , Maurice Karnaugh's 1953 refinement of Edward Veitch's 1952 Veitch diagram, is a method to simplify Boolean algebra expressions...
, Karnaugh in his method changed the order of the variables to correspond to what has become known as (the vertices of) a hypercube
Hypercube
In geometry, a hypercube is an n-dimensional analogue of a square and a cube . It is a closed, compact, convex figure whose 1-skeleton consists of groups of opposite parallel line segments aligned in each of the space's dimensions, perpendicular to each other and of the same length.An...
.
Example: Euler- to Venn-diagram and Karnaugh map
This example shows the Euler and Venn diagrams and Karnaugh map deriving and verifying the deduction "No X's are Z's".In the illustration and table the following logical symbols are used:
- 1 can be read as "true", 0 as "false"
- ~ for NOT and abbreviated to ' when illustrating the minterms e.g. x' =defined NOT x,
- + for Boolean OR (from Boolean algebra: 0+0=0, 0+1 = 1+0 = 1, 1+1=1)
- & (logical AND) between propositions; in the mintems AND is omitted in a manner similar to arithmetic multiplication: e.g. x'y'z =defined ~x & ~y & z (From Boolean algebra: 0*0=0, 0*1 = 1*0=0, 1*1 = 1, where * is shown for clarity)
- → (logical IMPLICATION): read as IF ... THEN ..., or " IMPLIES ", P → Q =defined NOT P OR Q
Given a proposed conclusion such as "No X is a Z", one can test whether or not it is a correct deduction
Deductive reasoning
Deductive reasoning, also called deductive logic, is reasoning which constructs or evaluates deductive arguments. Deductive arguments are attempts to show that a conclusion necessarily follows from a set of premises or hypothesis...
by use of a truth table
Truth table
A truth table is a mathematical table used in logic—specifically in connection with Boolean algebra, boolean functions, and propositional calculus—to compute the functional values of logical expressions on each of their functional arguments, that is, on each combination of values taken by their...
. The easiest method is put the starting formula on the left (abbreviate it as "P") and put the (possible) deduction on the right (abbreviate it as "Q") and connect the two with logical implication i.e. P → Q, read as IF P THEN Q. If the evaluation of the truth table produces all 1's under the implication-sign (→, the so-called major connective) then P → Q is a tautology
Tautology
Tautology may refer to:*Tautology , using different words to say the same thing even if the repetition does not provide clarity. Tautology also means a series of self-reinforcing statements that cannot be disproved because the statements depend on the assumption that they are already...
. Given this fact, one can "detach" the formula on the right (abbreviated as "Q") in the manner described below the truth table.
Given the example above, the formula for the Euler and Venn diagrams is:
- "No Y's are Z's" and "All X's are Y's": ( ~(y & z) & (x → y) ) =defined P
And the proposed deduction is:
- "No X's are Z's": ( ~ (x & z) ) =defined Q
So now the formula to be evaluated can be abbreviated to:
- ( ~(y & z) & (x → y) ) → ( ~ (x & z) ): P → Q
- IF ( "No Y's are Z's" and "All X's are Y's" ) THEN ( "No X's are Z's" )
| Square # | Venn, Karnaugh region | x | y | z | (~ | (y | & | z) | & | (x | → | y)) | → | (~ | (x | & | z)) | ||
| 0 | x'y'z' | 0 | 0 | 0 | 1 | 0 | 0 | 0 | 1 | 0 | 1 | 0 | 1 | 1 | 0 | 0 | 0 | ||
| 1 | x'y'z | 0 | 0 | 1 | 1 | 0 | 0 | 1 | 1 | 0 | 1 | 0 | 1 | 1 | 0 | 0 | 1 | ||
| 2 | x'yz' | 0 | 1 | 0 | 1 | 1 | 0 | 0 | 1 | 0 | 1 | 1 | 1 | 1 | 0 | 0 | 0 | ||
| 3 | x'yz | 0 | 1 | 1 | 0 | 1 | 1 | 1 | 0 | 0 | 1 | 1 | 1 | 1 | 0 | 0 | 1 | ||
| 4 | xy'z' | 1 | 0 | 0 | 1 | 0 | 0 | 0 | 0 | 1 | 0 | 0 | 1 | 1 | 1 | 0 | 0 | ||
| 5 | xy'z | 1 | 0 | 1 | 1 | 0 | 0 | 1 | 0 | 1 | 0 | 0 | 1 | 0 | 1 | 1 | 1 | ||
| 6 | xyz' | 1 | 1 | 0 | 1 | 1 | 0 | 0 | 1 | 1 | 1 | 1 | 1 | 1 | 1 | 0 | 0 | ||
| 7 | xyz | 1 | 1 | 1 | 0 | 1 | 1 | 1 | 0 | 1 | 1 | 1 | 1 | 0 | 1 | 1 | 1 |
At this point the above implication P → Q (i.e. ~(y & z) & (x → y) ) → ~(x & z) ) is still a formula, and the deduction – the "detachment" of Q out of P → Q – has not occurred. But given the demonstration that P → Q is tautology, the stage is now set for the use of the procedure of modus ponens
Modus ponens
In classical logic, modus ponendo ponens or implication elimination is a valid, simple argument form. It is related to another valid form of argument, modus tollens. Both Modus Ponens and Modus Tollens can be mistakenly used when proving arguments...
to "detach" Q: "No X's are Z's" and dispense with the terms on the left.
Modus ponens (or "the fundamental rule of inference") is often written as follows: The two terms on the left, "P → Q" and "P", are called premises (by convention linked by a comma), the symbol ⊢ means "yields" (in the sense of logical deduction), and the term on the right is called the conclusion:
- P → Q, P ⊢ Q
For the modus ponens to succeed, both premises P → Q and P must be true. Because, as demonstrated above the premise P → Q is a tautology, "truth" is always the case no matter how x, y and z are valued, but "truth" will only be the case for P in those circumstances when P evaluates as "true" (e.g. rows 0 OR 1 OR 2 OR 6: x'y'z' + x'y'z + x'yz' + xyz' = x'y' + yz').
- P → Q , P ⊢ Q
- i.e.: ( ~(y & z) & (x → y) ) → ( ~ (x & z) ) , ( ~(y & z) & (x → y) ) ⊢ ( ~ (x & z) )
- i.e.: IF "No Y's are Z's" and "All X's are Y's" THEN "No X's are Z's", "No Y's are Z's" and "All X's are Y's" ⊢ "No X's are Z's"
One is now free to "detach" the conclusion "No X's are Z's", perhaps to use it in a subsequent deduction (or as a topic of conversation).
The use of tautological implication means that other possible deductions exist besides "No X's are Z's"; the criterion for a successful deduction is that the 1's under the sub-major connective on the right include all the 1's under the sub-major connective on the left (the major connective being the implication that results in the tautology). For example, in the truth table, on the right side of the implication (→, the major connective symbol) the bold-face column under the sub-major connective symbol " ~ " has the all the same 1s that appear in the bold-faced column under the left-side sub-major connective & (rows 0, 1, 2 and 6), plus two more (rows 3 and 4).
External links
- Euler Diagrams. Brighton, UK (2004).What are Euler Diagrams?
- Visualisation with Euler diagrams project