
Economic graph
Encyclopedia
The social science of economics
makes extensive use graphs to better illustrate the economic principles and trends it is attempting to explain. Those graphs have specific qualities that are not often found (or are not often found in such combinations) in other sciences.
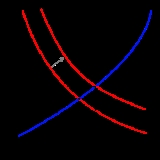
 A common and specific example is the Supply and Demand
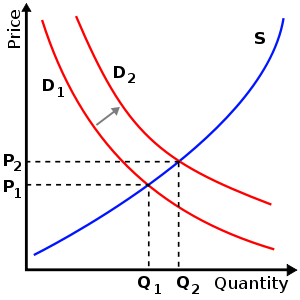
graph shown at right. This graph shows supply and demand as opposing curves, and the intersection between those curves determines the price point
. An alteration of either supply or demand is shown by displacing the curve towards or away the zero-line of the graph's X or Y coordinates, and once this is done, the illustrated price points (P) and matching quantity (Q) are altered (in the shown example, from P1 to P2 and from Q1 to Q2).
Economic graphs frequently present only in the first quadrant of the Cartesian plane. Even though the axes refer to numeric variables, specific values are seldom introduced. The economic analysis
under discussion deals with forces peculiar to the field of economics, and generally stops short of use of hyperbolic coordinates.
More generally, there is usually some underlying mathematical model which underlies any given economic graph. For instance, the commonly found supply and demand graph has its underpinnings in general price theory - a highly mathematical discipline.
Economics
Economics is the social science that analyzes the production, distribution, and consumption of goods and services. The term economics comes from the Ancient Greek from + , hence "rules of the house"...
makes extensive use graphs to better illustrate the economic principles and trends it is attempting to explain. Those graphs have specific qualities that are not often found (or are not often found in such combinations) in other sciences.
Supply and demand
Supply and demand is an economic model of price determination in a market. It concludes that in a competitive market, the unit price for a particular good will vary until it settles at a point where the quantity demanded by consumers will equal the quantity supplied by producers , resulting in an...
graph shown at right. This graph shows supply and demand as opposing curves, and the intersection between those curves determines the price point
Price point
Price points are prices at which demand for a given product is supposed to stay relatively high.- Characteristics :Introductory microeconomics depicts a demand curve as downward-sloping to the right and either linear or gently convex to the origin...
. An alteration of either supply or demand is shown by displacing the curve towards or away the zero-line of the graph's X or Y coordinates, and once this is done, the illustrated price points (P) and matching quantity (Q) are altered (in the shown example, from P1 to P2 and from Q1 to Q2).
Economic graphs frequently present only in the first quadrant of the Cartesian plane. Even though the axes refer to numeric variables, specific values are seldom introduced. The economic analysis
Analysis
Analysis is the process of breaking a complex topic or substance into smaller parts to gain a better understanding of it. The technique has been applied in the study of mathematics and logic since before Aristotle , though analysis as a formal concept is a relatively recent development.The word is...
under discussion deals with forces peculiar to the field of economics, and generally stops short of use of hyperbolic coordinates.
More generally, there is usually some underlying mathematical model which underlies any given economic graph. For instance, the commonly found supply and demand graph has its underpinnings in general price theory - a highly mathematical discipline.