

Demographics of Serbia
Encyclopedia
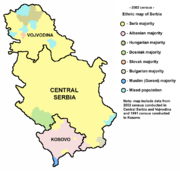
The demographics of Serbia have been shaped by its unique geographic location. Situated in the middle of the Balkans, many different ethnic group
s are citizens of Serbia. Serbs
are overwhelmingly the largest ethnic group in the country. Furthermore, Albanians
have represented the largest minority group in modern Serbia. Other important ethnic groups by size include Hungarians, Bosniaks
, Roma, Croats
, Slovaks
, Bulgarians
, Romanians
. Furthermore, with over 25 different national communities Vojvodina, Serbias northern region is one of the most ethnically diverse territories in Europe
.
The two provinces of Vojvodina and Kosovo, have a sizable minority groups. Hungarians in Vojvodina are mainly Catholic
stemming from the Austria-Hungary
influence while Albanians in Kosovo are mainly Muslim
stemming from the Ottoman Empire
influence.
p - preliminary results
 Serbia has a mixed population that varies in the three regions, Kosovo
, Vojvodina
and Central Serbia
. Serbs are the largest ethnic group in Central Serbia and Vojvodina while they are a minority in Kosovo. In Central Serbia, Serbs represents 89.5 percent of the population, and Bosniaks
are the second largest minority with 2.5 percent, followed by the Roma and Albanians. In Vojvodina, Serbs represent 65 percent of the population while Hungarians
are the second largest ethnic group, representing 14% of provincial population. Kosovo is mainly populated by ethnic Albanians who make up 87 percent of the population. Serbs are the second largest ethnic group in Kosovo with 7 percent of the population, while Gorani, Roma, and Turks, represents six percent of the population combined.
The ethnic composition of Central Serbia
and Vojvodina
, according to the 2002 census:
)
definition: age 15 and over can read and write
Ethnic group
An ethnic group is a group of people whose members identify with each other, through a common heritage, often consisting of a common language, a common culture and/or an ideology that stresses common ancestry or endogamy...
s are citizens of Serbia. Serbs
Serbs
The Serbs are a South Slavic ethnic group of the Balkans and southern Central Europe. Serbs are located mainly in Serbia, Montenegro and Bosnia and Herzegovina, and form a sizable minority in Croatia, the Republic of Macedonia and Slovenia. Likewise, Serbs are an officially recognized minority in...
are overwhelmingly the largest ethnic group in the country. Furthermore, Albanians
Albanians
Albanians are a nation and ethnic group native to Albania and neighbouring countries. They speak the Albanian language. More than half of all Albanians live in Albania and Kosovo...
have represented the largest minority group in modern Serbia. Other important ethnic groups by size include Hungarians, Bosniaks
Bosniaks
The Bosniaks or Bosniacs are a South Slavic ethnic group, living mainly in Bosnia and Herzegovina, with a smaller minority also present in other lands of the Balkan Peninsula especially in Serbia, Montenegro and Croatia...
, Roma, Croats
Croats
Croats are a South Slavic ethnic group mostly living in Croatia, Bosnia and Herzegovina and nearby countries. There are around 4 million Croats living inside Croatia and up to 4.5 million throughout the rest of the world. Responding to political, social and economic pressure, many Croats have...
, Slovaks
Slovaks
The Slovaks, Slovak people, or Slovakians are a West Slavic people that primarily inhabit Slovakia and speak the Slovak language, which is closely related to the Czech language.Most Slovaks today live within the borders of the independent Slovakia...
, Bulgarians
Bulgarians
The Bulgarians are a South Slavic nation and ethnic group native to Bulgaria and neighbouring regions. Emigration has resulted in immigrant communities in a number of other countries.-History and ethnogenesis:...
, Romanians
Romanians
The Romanians are an ethnic group native to Romania, who speak Romanian; they are the majority inhabitants of Romania....
. Furthermore, with over 25 different national communities Vojvodina, Serbias northern region is one of the most ethnically diverse territories in Europe
Europe
Europe is, by convention, one of the world's seven continents. Comprising the westernmost peninsula of Eurasia, Europe is generally 'divided' from Asia to its east by the watershed divides of the Ural and Caucasus Mountains, the Ural River, the Caspian and Black Seas, and the waterways connecting...
.
The two provinces of Vojvodina and Kosovo, have a sizable minority groups. Hungarians in Vojvodina are mainly Catholic
Catholic
The word catholic comes from the Greek phrase , meaning "on the whole," "according to the whole" or "in general", and is a combination of the Greek words meaning "about" and meaning "whole"...
stemming from the Austria-Hungary
Austria-Hungary
Austria-Hungary , more formally known as the Kingdoms and Lands Represented in the Imperial Council and the Lands of the Holy Hungarian Crown of Saint Stephen, was a constitutional monarchic union between the crowns of the Austrian Empire and the Kingdom of Hungary in...
influence while Albanians in Kosovo are mainly Muslim
Muslim
A Muslim, also spelled Moslem, is an adherent of Islam, a monotheistic, Abrahamic religion based on the Quran, which Muslims consider the verbatim word of God as revealed to prophet Muhammad. "Muslim" is the Arabic term for "submitter" .Muslims believe that God is one and incomparable...
stemming from the Ottoman Empire
Ottoman Empire
The Ottoman EmpireIt was usually referred to as the "Ottoman Empire", the "Turkish Empire", the "Ottoman Caliphate" or more commonly "Turkey" by its contemporaries...
influence.
1900-1912
- Source:
Average population (x 1,000) Live births Deaths Natural change Crude birth rate (per 1,000) Crude death rate (per 1,000) Natural change (per 1,000) 1900 2,470 105,000 58,000 47,000 42.4 23.5 18.9 1901 2,520 96,000 53,000 43,000 38.0 21.0 17.0 1902 2,570 98,000 57,000 41,000 38.0 22.3 15.7 1903 2,580 106,000 60,000 46,000 40.9 23.5 17.4 1904 2,650 106,000 56,000 50,000 39.8 21.1 18.7 1905 2,660 100,000 65,000 35,000 37.3 24.8 2.5 1906 2,690 113,000 66,000 47,000 42.0 24.5 17.5 1907 2,770 111,000 62,000 49,000 40.0 22.4 17.6 1908 2,820 104,000 67,000 37,000 36.8 23.7 13.1 1909 2,840 110,000 83,000 27,000 38.7 29.3 9.4 1910 2,870 112,000 64,000 48,000 39.0 22.4 16.6 1911 2,940 107,000 64,000 43,000 36.3 21.8 14.5 1912 2,980 114,000 63,000 51,000 38.3 21.1 17.1
1950-2010
- Source:
Average population (x 1000) Live births Deaths Natural change Crude birth rate (per 1000) Crude death rate (per 1000) Natural change (per 1000) 1950 5 970 163 297 76 851 86 446 27.4 12.9 14.5 1951 6 042 145 197 80 034 65 163 24.0 13.2 10.8 1952 6 112 161 306 67 870 93 436 26.4 11.1 15.3 1953 6 188 151 672 68 168 83 504 24.5 11.0 13.5 1954 6 274 152 569 62 610 89 959 24.3 10.0 14.3 1955 6 358 140 396 65 179 75 217 22.1 10.3 11.8 1956 6 425 132 078 67 055 65 023 20.6 10.4 10.1 1957 6 481 118 535 64 885 53 650 18.3 10.0 8.3 1958 6 535 118 425 55 564 62 861 18.1 8.5 9.6 1959 6 585 114 872 60 850 54 022 17.4 9.2 8.2 1960 6 635 119 298 61 872 57 426 18.0 9.3 8.7 1961 6 693 115 222 57 990 57 232 17.2 8.7 8.6 1962 6 752 110 008 62 830 47 178 16.3 9.3 7.0 1963 6 809 108 324 57 778 50 546 15.9 8.5 7.4 1964 6 863 103 847 62 100 41 747 15.1 9.0 6.1 1965 6 916 106 699 58 856 47 843 15.4 8.5 6.9 1966 6 974 103 775 55 471 48 304 14.9 8.0 6.9 1967 7 027 103 491 62 915 40 576 14.7 9.0 5.8 1968 7 078 103 621 60 932 42 689 14.6 8.6 6.0 1969 7 127 105 478 68 152 37 326 14.8 9.6 5.2 1970 7 171 102 453 67 211 35 242 14.3 9.4 4.9 1971 7 214 104 070 65 872 38 198 14.4 9.1 5.3 1972 7 258 106 859 70 822 36 037 14.7 9.8 5.0 1973 7 303 108 361 67 152 41 209 14.8 9.2 5.6 1974 7 351 110 458 66 457 44 001 15.0 9.0 6.0 1975 7 401 112 945 69 590 43 355 15.3 9.4 5.9 1976 7 452 114 035 68 565 45 470 15.3 9.2 6.1 1977 7 503 111 510 68 924 42 586 14.9 9.2 5.7 1978 7 550 110 622 71 986 38 636 14.7 9.5 5.1 1979 7 611 109 953 72 306 37 647 14.4 9.5 4.9 1980 7 688 109 597 76 180 33 417 14.3 9.9 4.3 1981 7 729 103 407 78 086 25 321 13.4 10.1 3.3 1982 7 738 106 575 78 473 28 102 13.8 10.1 3.6 1983 7 747 108 003 83 506 24 497 13.9 10.8 3.2 1984 7 754 107 036 82 742 24 294 13.8 10.7 3.1 1985 7 759 101 938 81 836 20 102 13.1 10.5 2.6 1986 7 759 99 419 83 977 15 442 12.8 10.8 2.0 1987 7 757 98 279 83 426 14 853 12.7 10.8 1.9 1988 7 755 97 471 83 616 13 855 12.6 10.8 1.8 1989 7 773 91 270 85 256 6 014 11.7 11.0 0.8 1990 7 806 90 590 85 932 4 658 11.6 11.0 0.6 1991 7 836 90 378 89 072 1 306 11.5 11.4 0.2 1992 7 852 86 877 93 475 -6 598 11.1 11.9 -0.8 1993 7 848 87 931 95 121 -7 190 11.2 12.1 -0.9 1994 7 843 85 292 93 011 -7 719 10.9 11.9 -1.0 1995 7 837 86 236 93 933 -7 697 11.0 12.0 -1.0 1996 7 828 82 548 98 370 -15 822 10.5 12.6 -2.0 1997 7 831 79 716 98 068 -18 352 10.2 12.5 -2.3 1998 7 568 76 330 99 376 -23 046 10.1 13.1 -3.0 1999 7 540 72 222 101 444 -29 222 9.6 13.5 -3.9 2000 7 516 73 764 104 042 -30 278 9.8 13.8 -4.0 2001 7 503 78 435 99 008 -20 573 10.5 13.2 -2.7 2002 7 500 78 101 102 785 -24 684 10.4 13.7 -3.3 2003 7 481 79 025 103 946 -24 921 10.6 13.9 -3.3 2004 7 463 78 186 104 320 -26 134 10.5 14.0 -3.5 2005 7 441 72 180 106 771 -34 591 9.7 14.3 -4.6 2006 7 412 70 997 102 884 -31 887 9.6 13.9 -4.3 2007 7 382 68 102 102 805 -34 703 9.2 13.9 -4.7 2008 7 350 69 083 102 711 -33 628 9.4 14.0 -4.6 2009 7 321 70 299 104 000 -33 701 9.6 14.2 -4.6 2010 7 291 68 304 103 211 -34 907 9.4 14.2 -4.8
p - preliminary results
Current ethnic composition
Kosovo
Kosovo is a region in southeastern Europe. Part of the Ottoman Empire for more than five centuries, later the Autonomous Province of Kosovo and Metohija within Serbia...
, Vojvodina
Vojvodina
Vojvodina, officially called Autonomous Province of Vojvodina is an autonomous province of Serbia. Its capital and largest city is Novi Sad...
and Central Serbia
Central Serbia
Central Serbia , also referred to as Serbia proper , was the region of Serbia from 1945 to 2009. It included central parts of Serbia outside of the autonomous provinces of Kosovo and Vojvodina. The region of Central Serbia was not an administrative division of Serbia as such; it was under the...
. Serbs are the largest ethnic group in Central Serbia and Vojvodina while they are a minority in Kosovo. In Central Serbia, Serbs represents 89.5 percent of the population, and Bosniaks
Bosniaks
The Bosniaks or Bosniacs are a South Slavic ethnic group, living mainly in Bosnia and Herzegovina, with a smaller minority also present in other lands of the Balkan Peninsula especially in Serbia, Montenegro and Croatia...
are the second largest minority with 2.5 percent, followed by the Roma and Albanians. In Vojvodina, Serbs represent 65 percent of the population while Hungarians
Hungarians in Vojvodina
Hungarians are the second largest ethnic group in the Vojvodina province in northern Serbia. According to the 2002 census, there are 290,207 ethnic Hungarians in Vojvodina who compose 14.28% of the provincial population. The number of ethnic Hungarians in the whole of Serbia is 293,299, and their...
are the second largest ethnic group, representing 14% of provincial population. Kosovo is mainly populated by ethnic Albanians who make up 87 percent of the population. Serbs are the second largest ethnic group in Kosovo with 7 percent of the population, while Gorani, Roma, and Turks, represents six percent of the population combined.
Composition of Central Serbia and Vojvodina
| Ethnic group |
census 1948 | census 1953 | census 1961 | census 1971 | census 1981 | census 1991 | census 2002 | |||||||
|---|---|---|---|---|---|---|---|---|---|---|---|---|---|---|
| Number | % | Number | % | Number | % | Number | % | Number | % | Number | % | Number | % | |
| Serbs Serbs The Serbs are a South Slavic ethnic group of the Balkans and southern Central Europe. Serbs are located mainly in Serbia, Montenegro and Bosnia and Herzegovina, and form a sizable minority in Croatia, the Republic of Macedonia and Slovenia. Likewise, Serbs are an officially recognized minority in... |
4,651,819 | 80.2 | 4,963,070 | 80.4 | 5,477,670 | 82.0 | 5,788,547 | 80.4 | 5,972,661 | 77.3 | 6,616,917 | 80.3 | 6,212,838 | 82.9 |
| Croats Croats Croats are a South Slavic ethnic group mostly living in Croatia, Bosnia and Herzegovina and nearby countries. There are around 4 million Croats living inside Croatia and up to 4.5 million throughout the rest of the world. Responding to political, social and economic pressure, many Croats have... |
164,574 | 2.8 | 167,045 | 2.7 | 189,158 | 2.8 | 176,649 | 2.5 | 140,650 | 1.8 | 9412443 | 1.2 | 70,602 | 0.9 |
| Montenegrins | 46,810 | 0.8 | 54,718 | 0.9 | 67,165 | 1.0 | 93,705 | 1.3 | 120,438 | 1.6 | 117,761 | 1.6 | 69,049 | 0.9 |
| Yugoslavs Yugoslavs Yugoslavs is a national designation used by a minority of South Slavs across the countries of the former Yugoslavia and in the diaspora... |
14,873 | 0.2 | 122,904 | 1.7 | 439,265 | 5.7 | 312,595 | 4.1 | 80,721 | 1.1 | ||||
| Muslims | 7,636 | 0.1 | 74,840 | 1.2 | 85,441 | 1.3 | 127,973 | 1.8 | 156,604 | 2.0 | 176,401 | 2.3 | 19,503 | 0.3 |
| Bosniacs | 136,087 | 1.8 | ||||||||||||
| Hungarians | 433,618 | 7.5 | 441,748 | 7.2 | 449,377 | 6.7 | 430,145 | 6.0 | 390,321 | 5.0 | 337,479 | 4.5 | 293,299 | 3.9 |
| Romani | 40,951 | 0.7 | 46,896 | 0.8 | 6,624 | 0.1 | 35,301 | 0.5 | 76,833 | 1.0 | 90,853 | 1.2 | 108,193 | 1.4 |
| Slovaks Slovaks The Slovaks, Slovak people, or Slovakians are a West Slavic people that primarily inhabit Slovakia and speak the Slovak language, which is closely related to the Czech language.Most Slovaks today live within the borders of the independent Slovakia... |
73,138 | 1.3 | 75,006 | 1.2 | 77,816 | 1.2 | 76,707 | 1.1 | 73,170 | 0.9 | 65,363 | 0.9 | 59,021 | 0.8 |
| Albanians Albanians Albanians are a nation and ethnic group native to Albania and neighbouring countries. They speak the Albanian language. More than half of all Albanians live in Albania and Kosovo... |
33,769 | 0.6 | 40,954 | 0.7 | 53,167 | 0.8 | 68,593 | 1.0 | 76,296 | 1.0 | 74,303 | 1.0 | 61,647 | 0.8 |
| Vlachs Vlachs Vlach is a blanket term covering several modern Latin peoples descending from the Latinised population in Central, Eastern and Southeastern Europe. English variations on the name include: Walla, Wlachs, Wallachs, Vlahs, Olahs or Ulahs... |
93,440 | 1.6 | 28,047 | 0.5 | 1,367 | 0.0 | 14,719 | 0.2 | 25,592 | 0.3 | 15,675 | 0.2 | 40,054 | 0.5 |
| Romanians Romanians The Romanians are an ethnic group native to Romania, who speak Romanian; they are the majority inhabitants of Romania.... |
63,112 | 1.1 | 59,689 | 1.0 | 59,492 | 0.9 | 57,399 | 0.8 | 53,676 | 0.7 | 37,818 | 0.5 | 34,576 | 0.5 |
| Macedonians Macedonians (ethnic group) The Macedonians also referred to as Macedonian Slavs: "... the term Slavomacedonian was introduced and was accepted by the community itself, which at the time had a much more widespread non-Greek Macedonian ethnic consciousness... |
17,391 | 0.3 | 26,302 | 0.4 | 35,146 | 0.5 | 41,627 | 0.6 | 47,930 | 0.6 | 44,028 | 0.6 | 25,847 | 0.3 |
| Bulgarians Bulgarians The Bulgarians are a South Slavic nation and ethnic group native to Bulgaria and neighbouring regions. Emigration has resulted in immigrant communities in a number of other countries.-History and ethnogenesis:... |
59,395 | 1.0 | 60,146 | 1.0 | 58,243 | 0.9 | 53,536 | 0.7 | 33,294 | 0.4 | 26,416 | 0.3 | 20,497 | 0.3 |
| Others/undeclared | 114,493 | 2.0 | 132,549 | 2.1 | 102,700 | 1.5 | 115,093 | 1.6 | 122,506 | 1.6 | 97,953 | 1.3 | 266,067 | 3.5 |
| Total | 5,800,146 | 6,171,013 | 6,678,239 | 7,202,898 | 7,729,236 | 7,552,806 | 7,498,001 | |||||||
The ethnic composition of Central Serbia
Central Serbia
Central Serbia , also referred to as Serbia proper , was the region of Serbia from 1945 to 2009. It included central parts of Serbia outside of the autonomous provinces of Kosovo and Vojvodina. The region of Central Serbia was not an administrative division of Serbia as such; it was under the...
and Vojvodina
Vojvodina
Vojvodina, officially called Autonomous Province of Vojvodina is an autonomous province of Serbia. Its capital and largest city is Novi Sad...
, according to the 2002 census:
| Serbia (excluding Kosovo) | Central Serbia Central Serbia Central Serbia , also referred to as Serbia proper , was the region of Serbia from 1945 to 2009. It included central parts of Serbia outside of the autonomous provinces of Kosovo and Vojvodina. The region of Central Serbia was not an administrative division of Serbia as such; it was under the... |
Vojvodina Vojvodina Vojvodina, officially called Autonomous Province of Vojvodina is an autonomous province of Serbia. Its capital and largest city is Novi Sad... |
||||
| Number | % | Number | % | Number | % | |
| TOTAL | 7,498,001 | 100 | 5,466,009 | 100 | 2,031,992 | 100 |
| Serbs Serbs The Serbs are a South Slavic ethnic group of the Balkans and southern Central Europe. Serbs are located mainly in Serbia, Montenegro and Bosnia and Herzegovina, and form a sizable minority in Croatia, the Republic of Macedonia and Slovenia. Likewise, Serbs are an officially recognized minority in... |
6,212,838 | 82.86 | 4,891,031 | 89.48 | 1,321,807 | 65.05 |
| Montenegrins | 69,049 | 0.92 | 33,536 | 0.61 | 35,513 | 1.75 |
| Yugoslavs Yugoslavs Yugoslavs is a national designation used by a minority of South Slavs across the countries of the former Yugoslavia and in the diaspora... |
80,721 | 1.08 | 30,840 | 0.56 | 49,881 | 2.45 |
| Albanians Albanians Albanians are a nation and ethnic group native to Albania and neighbouring countries. They speak the Albanian language. More than half of all Albanians live in Albania and Kosovo... |
61,647 | 0.82 | 59,952 | 1.1 | 1,695 | 0.08 |
| Bosniaks Bosniaks The Bosniaks or Bosniacs are a South Slavic ethnic group, living mainly in Bosnia and Herzegovina, with a smaller minority also present in other lands of the Balkan Peninsula especially in Serbia, Montenegro and Croatia... |
136,087 | 1.82 | 135,670 | 2.48 | 417 | 0.02 |
| Bulgarians Bulgarians The Bulgarians are a South Slavic nation and ethnic group native to Bulgaria and neighbouring regions. Emigration has resulted in immigrant communities in a number of other countries.-History and ethnogenesis:... |
20,497 | 0.27 | 18,839 | 0.34 | 1,658 | 0.08 |
| Bunjevci Bunjevci Bunjevci are a South Slavic community and ethnic group living mostly in the Bačka region of Serbia and southern Hungary... |
20,012 | 0.27 | 246 | 0 | 19,766 | 0.97 |
| Gorani Gorani (Kosovo) The Gorani or Goranci are a South Slavic ethnic group inhabiting the Gora region of the Balkans, located at the triangle between Albania, Kosovo and Macedonia. Another autonym of this people is "Našinci" with literally meaning "our people"... |
4,581 | 0.06 | 3,975 | 0.07 | 606 | 0.03 |
| Croats Croats Croats are a South Slavic ethnic group mostly living in Croatia, Bosnia and Herzegovina and nearby countries. There are around 4 million Croats living inside Croatia and up to 4.5 million throughout the rest of the world. Responding to political, social and economic pressure, many Croats have... |
70,602 | 0.94 | 14,056 | 0.26 | 56,546 | 2.78 |
| Macedonians Macedonians (ethnic group) The Macedonians also referred to as Macedonian Slavs: "... the term Slavomacedonian was introduced and was accepted by the community itself, which at the time had a much more widespread non-Greek Macedonian ethnic consciousness... |
25,847 | 0.35 | 14,062 | 0.26 | 11,785 | 0.58 |
| Muslims Muslims by nationality Muslims by nationality was a term used in Socialist Federal Republic of Yugoslavia as an official designation of nationality of Slavic Muslims. They were one of the constitutive groups of Bosnia and Herzegovina... (by nationality) |
19,503 | 0.26 | 15,869 | 0.29 | 3,634 | 0.18 |
| Roma and Sinti Sinti Sinti or Sinta or Sinte is the name of a Romani or Gypsy population in Europe. Traditionally nomadic, today only a small percentage of the group remains unsettled... |
108,193 | 1.44 | 79,136 | 1.45 | 29,057 | 1.43 |
| Vlachs of Serbia | 40,054 | 0.53 | 39,953 | 0.73 | 101 | 0 |
| Romanians of Serbia Romanians of Serbia Romanians are a recognised national minority in Serbia. The total number of declared Romanians in the 2002 Serbian census was 34,576, while 40,054 people declared themselves Vlachs; there are differing views among some of the Vlachs over they should be regarded as Romanians or as members of a... |
34,576 | 0.46 | 4,157 | 0.08 | 30,419 | 1.5 |
| Germans Germans The Germans are a Germanic ethnic group native to Central Europe. The English term Germans has referred to the German-speaking population of the Holy Roman Empire since the Late Middle Ages.... |
3,901 | 0.05 | 747 | 0.01 | 3,154 | 0.16 |
| Ruthenes | 15,905 | 0.21 | 279 | 0.01 | 15,626 | 0.77 |
| Russians Russians The Russian people are an East Slavic ethnic group native to Russia, speaking the Russian language and primarily living in Russia and neighboring countries.... |
2,588 | 0.03 | 1,648 | 0.03 | 940 | 0.05 |
| Slovaks Slovaks The Slovaks, Slovak people, or Slovakians are a West Slavic people that primarily inhabit Slovakia and speak the Slovak language, which is closely related to the Czech language.Most Slovaks today live within the borders of the independent Slovakia... |
59,021 | 0.79 | 2,384 | 0.04 | 56,637 | 2.79 |
| Slovenes | 5,104 | 0.07 | 3,099 | 0.06 | 2,005 | 0.1 |
| Czechs | 2,211 | 0.03 | 563 | 0.01 | 1,648 | 0.08 |
| Ukrainians Ukrainians Ukrainians are an East Slavic ethnic group native to Ukraine, which is the sixth-largest nation in Europe. The Constitution of Ukraine applies the term 'Ukrainians' to all its citizens... |
5,354 | 0.07 | 719 | 0.01 | 4,635 | 0.23 |
| Hungarians | 293,299 | 3.91 | 3,092 | 0.06 | 290,207 | 14.28 |
| Others (i.e. Armenians Armenians Armenian people or Armenians are a nation and ethnic group native to the Armenian Highland.The largest concentration is in Armenia having a nearly-homogeneous population with 97.9% or 3,145,354 being ethnic Armenian.... , Serbian Jews Jews The Jews , also known as the Jewish people, are a nation and ethnoreligious group originating in the Israelites or Hebrews of the Ancient Near East. The Jewish ethnicity, nationality, and religion are strongly interrelated, as Judaism is the traditional faith of the Jewish nation... , Greeks Greeks The Greeks, also known as the Hellenes , are a nation and ethnic group native to Greece, Cyprus and neighboring regions. They also form a significant diaspora, with Greek communities established around the world.... , Turks Turkish people Turkish people, also known as the "Turks" , are an ethnic group primarily living in Turkey and in the former lands of the Ottoman Empire where Turkish minorities had been established in Bulgaria, Cyprus, Bosnia and Herzegovina, Georgia, Greece, Kosovo, Macedonia, and Romania... and Egyptians). |
11,711 | 0.16 | 6,400 | 0.12 | 5,311 | 0.26 |
| Unspecified | 107,732 | 1.44 | 52,716 | 0.97 | 55,016 | 2.71 |
| Unknown | 75,483 | 1.01 | 51,709 | 0.95 | 23,774 | 1.17 |
Current religious composition
Demographic statistics
The following demographic statistics are from the CIA World Factbook, unless otherwise indicated.Life expectancy at birth
- total population: 75.3 years
- male: 71.26 years
- female: 77.1 years
Religions
(2002 census)- Christianity
- Eastern OrthodoxyOrthodoxy in SerbiaEastern Orthodox Christianity is the main religion in Serbia, with 6,371,584 followers or 84% of the whole country. Orthodox Christianity is the religion of ethnic Serbs, Romanians , Montenegrins, Macedonians and Bulgarians living in Serbia...
— 84.1% - Roman Catholicism — 6.24%
- ProtestantismProtestantismProtestantism is one of the three major groupings within Christianity. It is a movement that began in Germany in the early 16th century as a reaction against medieval Roman Catholic doctrines and practices, especially in regards to salvation, justification, and ecclesiology.The doctrines of the...
— 1.44%
- Eastern Orthodoxy
- IslamIslam in SerbiaThe Muslims in Serbia are mostly ethnic Bosniaks and Albanians, but also members of the smaller ethnic groups like Muslims by nationality, Ashkali, Egyptians, Gorani, Roma, and Turks.-Number of believers and distribution:...
— 4.82%
Languages
- Official: SerbianSerbian languageSerbian is a form of Serbo-Croatian, a South Slavic language, spoken by Serbs in Serbia, Bosnia and Herzegovina, Montenegro, Croatia and neighbouring countries....
(official nationwide)- VojvodinaVojvodinaVojvodina, officially called Autonomous Province of Vojvodina is an autonomous province of Serbia. Its capital and largest city is Novi Sad...
: SerbianSerbian languageSerbian is a form of Serbo-Croatian, a South Slavic language, spoken by Serbs in Serbia, Bosnia and Herzegovina, Montenegro, Croatia and neighbouring countries....
, RomanianRomanian languageRomanian Romanian Romanian (or Daco-Romanian; obsolete spellings Rumanian, Roumanian; self-designation: română, limba română ("the Romanian language") or românește (lit. "in Romanian") is a Romance language spoken by around 24 to 28 million people, primarily in Romania and Moldova...
, HungarianHungarian languageHungarian is a Uralic language, part of the Ugric group. With some 14 million speakers, it is one of the most widely spoken non-Indo-European languages in Europe....
, SlovakSlovak languageSlovak , is an Indo-European language that belongs to the West Slavic languages .Slovak is the official language of Slovakia, where it is spoken by 5 million people...
, RusynRusyn languageRusyn , also known in English as Ruthenian, is an East Slavic language variety spoken by the Rusyns of Central Europe. Some linguists treat it as a distinct language and it has its own ISO 639-3 code; others treat it as a dialect of Ukrainian...
, and CroatianCroatian languageCroatian is the collective name for the standard language and dialects spoken by Croats, principally in Croatia, Bosnia and Herzegovina, the Serbian province of Vojvodina and other neighbouring countries... - KosovoKosovoKosovo is a region in southeastern Europe. Part of the Ottoman Empire for more than five centuries, later the Autonomous Province of Kosovo and Metohija within Serbia...
: SerbianSerbian languageSerbian is a form of Serbo-Croatian, a South Slavic language, spoken by Serbs in Serbia, Bosnia and Herzegovina, Montenegro, Croatia and neighbouring countries....
, AlbanianAlbanian languageAlbanian is an Indo-European language spoken by approximately 7.6 million people, primarily in Albania and Kosovo but also in other areas of the Balkans in which there is an Albanian population, including western Macedonia, southern Montenegro, southern Serbia and northwestern Greece...
- Vojvodina
Literacy
(includes data for MontenegroMontenegro
Montenegro Montenegrin: Crna Gora Црна Гора , meaning "Black Mountain") is a country located in Southeastern Europe. It has a coast on the Adriatic Sea to the south-west and is bordered by Croatia to the west, Bosnia and Herzegovina to the northwest, Serbia to the northeast and Albania to the...
)
definition: age 15 and over can read and write
- total population: 96.4%
- male: 98.9%
- female: 94.1% (2002 est.)
See also
- Demographic history of SerbiaDemographic history of SerbiaThis article presents the demographic history of Serbia through census results. See Demographics of Serbia for a more detailed overview of the current demographics from 2002 census.- 1349 :...
- Demographic history of VojvodinaDemographic history of VojvodinaVojvodina's demographic history reflects its rich history and its former location at the border of the Ottoman and Habsburg empires and at the confluence of various peoples, making it a hotbed of invasion, colonization, and assimilation processes...
- Demographic history of KosovoDemographic history of KosovoThe demographic features of the population of Kosovo, includes various factors such as population density, ethnicity, education level, health of the populace, economic status, religious affiliations and other aspects of the population....