
Demographics of Belgium
Encyclopedia
This article is about the demographic
features of the population
of Belgium
, including ethnicity
, education level, health of the populace, economic status, religious affiliations and other aspects of the population. All figures are from the Nationaal Instituut voor Statistiek, unless otherwise indicated.
The population of Flanders, Wallonia and Brussels on January 1st, 2010 was 6,251,983 (57.7%), 3,498,384 (32.3%) and 1,089,538 (10.1%), respectively.
Female: 80.9 in 1999, 82.4 in 2009
Total: 77.7 in 1999, 79.8 in 2009
majority of about 6,000,000 people speaking Dutch, a Walloon
minority of 3,400,000 people speaking French, and about 73,000 German
speaking people in Wallonia, near the German border. However, David Levinson reports that "the Flemish and Walloon groups are described by experts as "communities" rather than as ethnic groups, and individuals can move easily from one community to the other by learning to speak the other language".
The rest consists mostly of French-speaking people from Brussels, Italians, Dutch
, French
, Moroccans, Algeria
ns, Turks
, Congolese
, Poles
, and India
ns. (Around 23% of Belgium's population is of non-Belgian origin)
The exact number of French-speakers in Brussels is hard to determine, but it is estimated that 77% of the people living in Brussels use French and 16% use Dutch in their households, as the sole language or secondary language. See the Brussels
article for more details.
, spoken by 60% of the population, French, spoken by 39%, and German, spoken by less than 1%. The vast majority of Belgium's population, 99%, is literate as defined by the Belgian government, i.e. capable of reading and writing in an official language by the time a citizen has reached the age of 15.
. Protestant, Muslim, agnostic, atheist and other minority religions comprise 25% of the population.
15–64 years: 66.3% (male 3,480,072/female 3,419,721)
65 years and over: 17.6% (male 760,390/female 1,047,477) (2009 est.)
Under 15 years: 1.04 male(s)/female
15–64 years: 1.02 male(s)/female
65 years and over: 0.71 male(s)/female
Total population: 0.96 male(s)/female (2009 est.)

Total population: 99%
Male: 99%
Female: 99%
Demographics
Demographics are the most recent statistical characteristics of a population. These types of data are used widely in sociology , public policy, and marketing. Commonly examined demographics include gender, race, age, disabilities, mobility, home ownership, employment status, and even location...
features of the population
Population
A population is all the organisms that both belong to the same group or species and live in the same geographical area. The area that is used to define a sexual population is such that inter-breeding is possible between any pair within the area and more probable than cross-breeding with individuals...
of Belgium
Belgium
Belgium , officially the Kingdom of Belgium, is a federal state in Western Europe. It is a founding member of the European Union and hosts the EU's headquarters, and those of several other major international organisations such as NATO.Belgium is also a member of, or affiliated to, many...
, including ethnicity
Ethnic group
An ethnic group is a group of people whose members identify with each other, through a common heritage, often consisting of a common language, a common culture and/or an ideology that stresses common ancestry or endogamy...
, education level, health of the populace, economic status, religious affiliations and other aspects of the population. All figures are from the Nationaal Instituut voor Statistiek, unless otherwise indicated.
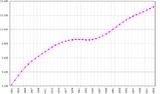
Population
Belgium had a population of 10,839,905 people on January 1st, 2010, an increase of 601,000 in comparison to 2000 (10,239,085 inhabitants). Between 1990 (9,947,782 inhabitants) and 2000 the increase was only 291,000.The population of Flanders, Wallonia and Brussels on January 1st, 2010 was 6,251,983 (57.7%), 3,498,384 (32.3%) and 1,089,538 (10.1%), respectively.
Immigration
In 2007, there were 1.38 million foreign-born residents in Belgium, corresponding to 12.9% of the total population. Of these, 685 000 (6.4%) were born outside the EU and 695 000 (6.5%) were born in another EU Member State.Births and deaths
Note: Territorial changes in East-Belgium occurred in 1925, 1940 and 1944.| Average population (x 1,000) | Live births | Deaths | Natural change | Crude birth rate (per 1,000) | Crude death rate (per 1,000) | Natural change (per 1,000) | |
|---|---|---|---|---|---|---|---|
| 1900 | 6,719 | 193,789 | 129,046 | 64,743 | 28.8 | 19.2 | 9.6 |
| 1901 | 6,747 | 200,077 | 116,077 | 84,000 | 29.7 | 17.2 | 12.4 |
| 1902 | 6,848 | 195,871 | 119,330 | 76,541 | 28.6 | 17.4 | 11.2 |
| 1903 | 6,941 | 192,301 | 118,675 | 73,626 | 27.7 | 17.1 | 10.6 |
| 1904 | 7,030 | 191,721 | 119,506 | 72,215 | 27.3 | 17.0 | 10.3 |
| 1905 | 7,118 | 187,437 | 118,343 | 69,094 | 26.3 | 16.6 | 9.7 |
| 1906 | 7,200 | 186,271 | 118,884 | 67,387 | 25.9 | 16.5 | 9.4 |
| 1907 | 7,278 | 185,138 | 115,347 | 69,791 | 25.4 | 15.8 | 9.6 |
| 1908 | 7,352 | 183,834 | 121,964 | 61,870 | 25.0 | 16.6 | 8.4 |
| 1909 | 7,419 | 176,431 | 117,571 | 58,860 | 23.8 | 15.8 | 7.9 |
| 1910 | 7,438 | 176,413 | 112,826 | 63,587 | 23.7 | 15.2 | 8.5 |
| 1911 | 7,457 | 171,802 | 122,843 | 48,959 | 23.0 | 16.5 | 6.6 |
| 1912 | 7,531 | 171,187 | 112,378 | 58,809 | 22.7 | 14.9 | 7.8 |
| 1913 | 7,605 | 171,099 | 111,227 | 59,872 | 22.5 | 14.6 | 7.9 |
| 1914 | 7,662 | 156,389 | 108,720 | 47,669 | 20.4 | 14.2 | 6.2 |
| 1915 | 7,697 | 124,291 | 100,674 | 23,617 | 16.1 | 13.1 | 3.1 |
| 1916 | 7,701 | 99,360 | 101,044 | -1,684 | 12.9 | 13.1 | -0.2 |
| 1917 | 7,667 | 86,675 | 124,824 | -38,149 | 11.3 | 16.3 | -5.0 |
| 1918 | 7,599 | 85,056 | 157,340 | -72,284 | 11.2 | 20.7 | -9.5 |
| 1919 | 7,566 | 123,314 | 113,732 | 9,582 | 16.3 | 15.0 | 1.3 |
| 1920 | 7,491 | 164,950 | 102,505 | 62,445 | 22.0 | 13.7 | 8.3 |
| 1921 | 7,444 | 164,603 | 102,908 | 61,695 | 22.1 | 13.8 | 8.3 |
| 1922 | 7,511 | 154,871 | 106,615 | 48,256 | 20.6 | 14.2 | 6.4 |
| 1923 | 7,573 | 156,600 | 100,084 | 56,516 | 20.7 | 13.2 | 7.5 |
| 1924 | 7,646 | 154,083 | 99,653 | 54,430 | 20.2 | 13.0 | 7.1 |
| 1925 | 7,748 | 155,330 | 99,569 | 55,761 | 20.0 | 12.9 | 7.2 |
| 1926 | 7,843 | 151,009 | 101,018 | 49,991 | 19.3 | 12.9 | 6.4 |
| 1927 | 7,903 | 146,296 | 103,007 | 43,289 | 18.5 | 13.0 | 5.5 |
| 1928 | 7,968 | 148,071 | 102,270 | 45,801 | 18.6 | 12.8 | 5.7 |
| 1929 | 8,032 | 147,311 | 115,901 | 31,410 | 18.3 | 14.4 | 3.9 |
| 1930 | 8,076 | 152,530 | 103,397 | 49,133 | 18.9 | 12.8 | 6.1 |
| 1931 | 8,126 | 149,657 | 103,773 | 45,884 | 18.4 | 12.8 | 5.6 |
| 1932 | 8,186 | 145,835 | 104,221 | 41,614 | 17.8 | 12.7 | 5.1 |
| 1933 | 8,231 | 136,757 | 104,640 | 32,117 | 16.6 | 12.7 | 3.9 |
| 1934 | 8,262 | 133,514 | 96,851 | 36,663 | 16.2 | 11.7 | 4.4 |
| 1935 | 8,288 | 128,432 | 102,132 | 26,300 | 15.5 | 12.3 | 3.2 |
| 1936 | 8,315 | 127,751 | 101,595 | 26,156 | 15.4 | 12.2 | 3.1 |
| 1937 | 8,346 | 128,696 | 104,163 | 24,533 | 15.4 | 12.5 | 2.9 |
| 1938 | 8,374 | 133,610 | 104,684 | 28,926 | 16.0 | 12.5 | 3.5 |
| 1939 | 8,391 | 130,019 | 110,393 | 19,626 | 15.5 | 13.2 | 2.3 |
| 1940 | 8,301 | 112,497 | 125,083 | -12,586 | 13.6 | 15.1 | -1.5 |
| 1941 | 8,276 | 100,616 | 118,670 | -18,054 | 12.2 | 14.3 | -2.2 |
| 1942 | 8,246 | 108,603 | 117,291 | -8,688 | 13.2 | 14.2 | -1.1 |
| 1943 | 8,241 | 123,349 | 107,767 | 15,582 | 15.0 | 13.1 | 1.9 |
| 1944 | 8,291 | 127,122 | 124,861 | 2,261 | 15.3 | 15.1 | 0.3 |
| 1945 | 8,339 | 130,526 | 121,155 | 9,371 | 15.7 | 14.5 | 1.1 |
| 1946 | 8,367 | 152,962 | 110,413 | 42,549 | 18.3 | 13.2 | 5.1 |
| 1947 | 8,450 | 150,227 | 108,136 | 42,091 | 17.8 | 12.8 | 5.0 |
| 1948 | 8,557 | 150,416 | 108,016 | 42,400 | 17.6 | 12.6 | 5.0 |
| 1949 | 8,614 | 147,854 | 111,104 | 36,750 | 17.2 | 12.9 | 4.3 |
| 1950 | 8,639 | 145,672 | 108,236 | 37,436 | 16.9 | 12.5 | 4.3 |
| 1951 | 8,678 | 142,314 | 109,763 | 32,551 | 16.4 | 12.6 | 3.8 |
| 1952 | 8,730 | 146,064 | 104,178 | 41,886 | 16.7 | 11.9 | 4.8 |
| 1953 | 8,778 | 146,125 | 105,863 | 40,262 | 16.6 | 12.1 | 4.6 |
| 1954 | 8,819 | 148,538 | 105,033 | 43,505 | 16.8 | 11.9 | 4.9 |
| 1955 | 8,868 | 149,195 | 108,743 | 40,452 | 16.8 | 12.3 | 4.6 |
| 1956 | 8,924 | 150,210 | 108,761 | 41,449 | 16.8 | 12.2 | 4.6 |
| 1957 | 8,989 | 152,871 | 107,840 | 45,031 | 17.0 | 12.0 | 5.0 |
| 1958 | 9,053 | 155,048 | 106,051 | 48,997 | 17.1 | 11.7 | 5.4 |
| 1959 | 9,104 | 158,237 | 103,933 | 54,304 | 17.4 | 11.4 | 6.0 |
| 1960 | 9,153 | 154,787 | 113,938 | 40,849 | 16.9 | 12.4 | 4.5 |
| 1961 | 9,184 | 158,431 | 106,985 | 51,446 | 17.3 | 11.6 | 5.6 |
| 1962 | 9,251 | 155,061 | 112,758 | 42,303 | 16.8 | 12.2 | 4.6 |
| 1963 | 9,328 | 159,192 | 116,718 | 42,474 | 17.1 | 12.5 | 4.6 |
| 1964 | 9,428 | 160,838 | 110,100 | 50,738 | 17.1 | 11.7 | 5.4 |
| 1965 | 9,499 | 155,496 | 115,045 | 40,451 | 16.4 | 12.1 | 4.3 |
| 1966 | 9,528 | 151,096 | 115,613 | 35,483 | 15.9 | 12.1 | 3.7 |
| 1967 | 9,581 | 146,193 | 115,212 | 30,981 | 15.3 | 12.0 | 3.2 |
| 1968 | 9,619 | 141,984 | 121,744 | 20,240 | 14.8 | 12.7 | 2.1 |
| 1969 | 9,660 | 141,799 | 120,471 | 21,328 | 14.7 | 12.5 | 2.2 |
| 1970 | 9,656 | 142,168 | 118,660 | 23,508 | 14.7 | 12.3 | 2.4 |
| 1971 | 9,695 | 140,966 | 118,853 | 22,113 | 14.5 | 12.3 | 2.3 |
| 1972 | 9,711 | 136,304 | 117,424 | 18,880 | 14.0 | 12.1 | 1.9 |
| 1973 | 9,742 | 129,424 | 118,254 | 11,170 | 13.3 | 12.1 | 1.1 |
| 1974 | 9,772 | 123,674 | 116,159 | 7,515 | 12.7 | 11.9 | 0.8 |
| 1975 | 9,801 | 119,693 | 119,425 | 268 | 12.2 | 12.2 | 0.0 |
| 1976 | 9,818 | 121,034 | 118,641 | 2,393 | 12.3 | 12.1 | 0.2 |
| 1977 | 9,830 | 121,852 | 112,672 | 9,180 | 12.4 | 11.5 | 0.9 |
| 1978 | 9,840 | 122,592 | 115,388 | 7,204 | 12.5 | 11.7 | 0.7 |
| 1979 | 9,848 | 123,825 | 112,010 | 11,815 | 12.6 | 11.4 | 1.2 |
| 1980 | 9,849 | 124,398 | 113,699 | 10,699 | 12.6 | 11.5 | 1.1 |
| 1981 | 9,859 | 123,792 | 112,326 | 11,466 | 12.6 | 11.4 | 1.2 |
| 1982 | 9,856 | 120,231 | 111,871 | 8,360 | 12.2 | 11.4 | 0.8 |
| 1983 | 9,856 | 117,145 | 114,534 | 2,611 | 11.9 | 11.6 | 0.3 |
| 1984 | 9,855 | 115,715 | 109,658 | 6,057 | 11.7 | 11.1 | 0.6 |
| 1985 | 9,858 | 114,030 | 110,770 | 3,260 | 11.6 | 11.2 | 0.3 |
| 1986 | 9,862 | 117,102 | 111,343 | 5,759 | 11.9 | 11.3 | 0.6 |
| 1987 | 9,870 | 117,334 | 105,426 | 11,908 | 11.9 | 10.7 | 1.2 |
| 1988 | 9,902 | 119,456 | 104,552 | 14,904 | 12.1 | 10.6 | 1.5 |
| 1989 | 9,938 | 121,117 | 107,619 | 13,498 | 12.2 | 10.8 | 1.4 |
| 1990 | 9,967 | 123,726 | 104,818 | 18,908 | 12.4 | 10.5 | 1.9 |
| 1991 | 10,004 | 126,068 | 105,150 | 20,918 | 12.6 | 10.5 | 2.1 |
| 1992 | 10,045 | 124,774 | 104,200 | 20,574 | 12.4 | 10.4 | 2.0 |
| 1993 | 10,084 | 120,998 | 108,170 | 12,828 | 12.0 | 10.7 | 1.3 |
| 1994 | 10,116 | 116,449 | 104,894 | 11,555 | 11.5 | 10.4 | 1.1 |
| 1995 | 10,137 | 115,638 | 105,933 | 9,705 | 11.4 | 10.5 | 1.0 |
| 1996 | 10,157 | 115,214 | 104,140 | 11,074 | 11.3 | 10.3 | 1.1 |
| 1997 | 10,181 | 115,864 | 103,802 | 12,062 | 11.4 | 10.2 | 1.2 |
| 1998 | 10,203 | 114,276 | 104,583 | 9,693 | 11.2 | 10.3 | 1.0 |
| 1999 | 10,226 | 113,469 | 104,904 | 8,565 | 11.1 | 10.3 | 0.8 |
| 2000 | 10,251 | 114,883 | 104,903 | 9,980 | 11.2 | 10.2 | 1.0 |
| 2001 | 10,278 | 114,172 | 103,447 | 10,725 | 11.1 | 10.1 | 1.0 |
| 2002 | 10,333 | 111,225 | 105,642 | 5,583 | 10.8 | 10.2 | 0.5 |
| 2003 | 10,376 | 112,149 | 107,039 | 5,110 | 10.8 | 10.3 | 0.5 |
| 2004 | 10,421 | 115,618 | 101,946 | 13,672 | 11.1 | 9.8 | 1.3 |
| 2005 | 10,479 | 118,002 | 103,278 | 14,724 | 11.3 | 9.9 | 1.4 |
| 2006 | 10,548 | 121,382 | 101,587 | 19,795 | 11.5 | 9.6 | 1.9 |
| 2007 | 10,626 | 120,663 | 100,658 | 20,005 | 11.4 | 9.5 | 1.9 |
| 2008 | 10,710 | 128,049 | 104,587 | 23,462 | 12.0 | 9.8 | 2.2 |
| 2009 | 10,796 | 127,297 | 104,509 | 22,788 | 11.8 | 9.7 | 2.1 |
Total Fertility Rate
The total fertility rate (TFR) gradually increased during the last decade from 1.60 in 1997, 1.65 in 2002 and 1.82 in 2007. The rates in Brussels are higher than the national average (1.79 in 1997, 1.93 in 2002 and 2.09 in 2007), while they are below the average in Flanders (1.54 in 1997, 1.56 in 2002 and 1.77 in 2007).http://statbel.fgov.be/nl/statistieken/cijfers/bevolking/geboorten_vruchtbaarheid/vruchtbaarheidsindicatoren/verstreken/index.jspLife expectancy
Male: 74.4 in 1999, 77.2 in 2009Female: 80.9 in 1999, 82.4 in 2009
Total: 77.7 in 1999, 79.8 in 2009
Ethnic groups
The country is populated by a FlemishFlemish people
The Flemings or Flemish are the Dutch-speaking inhabitants of Belgium, where they are mostly found in the northern region of Flanders. They are one of two principal cultural-linguistic groups in Belgium, the other being the French-speaking Walloons...
majority of about 6,000,000 people speaking Dutch, a Walloon
Walloons
Walloons are a French-speaking people who live in Belgium, principally in Wallonia. Walloons are a distinctive community within Belgium, important historical and anthropological criteria bind Walloons to the French people. More generally, the term also refers to the inhabitants of the Walloon...
minority of 3,400,000 people speaking French, and about 73,000 German
German-speaking Community of Belgium
The German-speaking Community of Belgium is one of the three federal communities of Belgium. Covering an area of 854 km² within the province of Liège in Wallonia, it includes nine of the eleven municipalities of the so-called East Cantons...
speaking people in Wallonia, near the German border. However, David Levinson reports that "the Flemish and Walloon groups are described by experts as "communities" rather than as ethnic groups, and individuals can move easily from one community to the other by learning to speak the other language".
The rest consists mostly of French-speaking people from Brussels, Italians, Dutch
Dutch people
The Dutch people are an ethnic group native to the Netherlands. They share a common culture and speak the Dutch language. Dutch people and their descendants are found in migrant communities worldwide, notably in Suriname, Chile, Brazil, Canada, Australia, South Africa, New Zealand, and the United...
, French
French people
The French are a nation that share a common French culture and speak the French language as a mother tongue. Historically, the French population are descended from peoples of Celtic, Latin and Germanic origin, and are today a mixture of several ethnic groups...
, Moroccans, Algeria
Algeria
Algeria , officially the People's Democratic Republic of Algeria , also formally referred to as the Democratic and Popular Republic of Algeria, is a country in the Maghreb region of Northwest Africa with Algiers as its capital.In terms of land area, it is the largest country in Africa and the Arab...
ns, Turks
Turkish people
Turkish people, also known as the "Turks" , are an ethnic group primarily living in Turkey and in the former lands of the Ottoman Empire where Turkish minorities had been established in Bulgaria, Cyprus, Bosnia and Herzegovina, Georgia, Greece, Kosovo, Macedonia, and Romania...
, Congolese
Democratic Republic of the Congo
The Democratic Republic of the Congo is a state located in Central Africa. It is the second largest country in Africa by area and the eleventh largest in the world...
, Poles
Poles
thumb|right|180px|The state flag of [[Poland]] as used by Polish government and diplomatic authoritiesThe Polish people, or Poles , are a nation indigenous to Poland. They are united by the Polish language, which belongs to the historical Lechitic subgroup of West Slavic languages of Central Europe...
, and India
India
India , officially the Republic of India , is a country in South Asia. It is the seventh-largest country by geographical area, the second-most populous country with over 1.2 billion people, and the most populous democracy in the world...
ns. (Around 23% of Belgium's population is of non-Belgian origin)
The exact number of French-speakers in Brussels is hard to determine, but it is estimated that 77% of the people living in Brussels use French and 16% use Dutch in their households, as the sole language or secondary language. See the Brussels
Brussels
Brussels , officially the Brussels Region or Brussels-Capital Region , is the capital of Belgium and the de facto capital of the European Union...
article for more details.
Languages
Belgium's three official languages are DutchDutch language
Dutch is a West Germanic language and the native language of the majority of the population of the Netherlands, Belgium, and Suriname, the three member states of the Dutch Language Union. Most speakers live in the European Union, where it is a first language for about 23 million and a second...
, spoken by 60% of the population, French, spoken by 39%, and German, spoken by less than 1%. The vast majority of Belgium's population, 99%, is literate as defined by the Belgian government, i.e. capable of reading and writing in an official language by the time a citizen has reached the age of 15.
Religion
Most, 75% of Belgians, are nominally Roman CatholicRoman Catholicism in Belgium
The Belgian Catholic Church, part of the global Roman Catholic Church, is under the spiritual leadership of the Pope, the curia in Rome and the Conference of Belgian Bishops.-Dioceses:...
. Protestant, Muslim, agnostic, atheist and other minority religions comprise 25% of the population.
CIA World Factbook demographic statistics
The following demographic statistics are from the CIA World Factbook, unless otherwise indicated.Age structure
0–14 years: 16.1% (male 857,373/female 822,303)15–64 years: 66.3% (male 3,480,072/female 3,419,721)
65 years and over: 17.6% (male 760,390/female 1,047,477) (2009 est.)
Sex ratio
At birth: 1.04 male(s)/femaleUnder 15 years: 1.04 male(s)/female
15–64 years: 1.02 male(s)/female
65 years and over: 0.71 male(s)/female
Total population: 0.96 male(s)/female (2009 est.)
Literacy
Definition: age 15 and over can read and write (2003 est.)Total population: 99%
Male: 99%
Female: 99%
See also
- Belgian nationality lawBelgian nationality lawBelgian citizenship is based on a mixture of the principles of Jus sanguinis and Jus soli. In other words, both place of birth and Belgian parentage are relevant for determining whether a person is a Belgian citizen. It is regulated by the Code of Belgian Nationality.In some circumstances...
- Metropolitan areas in BelgiumMetropolitan areas in BelgiumNational statistics differ between five Metropolitan areas in Belgium. These five metropolitan areas are also covered by Eurostat statistics as separate Larger Urban Zones .- Metropolitan areas :...