
Demographic dividend
Encyclopedia
The demographic dividend is a rise in the rate of economic growth due to a rising share of working age people in a population. This usually occurs late in the demographic transition
when the fertility rate falls and the youth dependency rate declines. During this demographic window
of opportunity, output per capita rises. It has been argued that the demographic dividend played a role in the "economic miracles" of the East Asian Tigers
and that the economic boom in Ireland in the 1990s (the Celtic tiger
) was in part due to the legalization of contraception in 1979
and subsequent decline in the fertility rate. In Ireland the ratio of workers to dependents improved due to lower fertility but was raised further by increased female labor market participation and a reversal from outward migration of working age population to a net inflow. Africa, on the other hand continues to have high fertility and youth dependency rates, which contribute to its economic stagnation. The magnitude of the demographic dividend appears to be dependent on the ability of the economy to absorb and productively employ the extra workers, rather than be a pure demographic gift
.
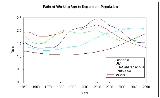
Low fertility initially leads to low youth dependency and a high ratio of working age to total population. However as the relatively large working age cohort grows older, population aging sets in. The graph shows the ratio of working age to dependent population (those 15 to 64 years old, divided by those above or below this age range - the inverse of the dependency ratio
) based on data and projections from the United Nations.
Demographic transition
The demographic transition model is the transition from high birth and death rates to low birth and death rates as a country develops from a pre-industrial to an industrialized economic system. The theory is based on an interpretation of demographic history developed in 1929 by the American...
when the fertility rate falls and the youth dependency rate declines. During this demographic window
Demographic window
Demographic window is defined to be that period of time in a nation's demographic evolution when the proportion of population of working age group is particularly prominent. This occurs when the demographic architecture of a population becomes younger and the percentage of people able to work...
of opportunity, output per capita rises. It has been argued that the demographic dividend played a role in the "economic miracles" of the East Asian Tigers
East Asian Tigers
The Four Asian Tigers or Asian Dragons is a term used in reference to the highly developed economies of Hong Kong, Singapore, South Korea and Taiwan. These nations and areas were notable for maintaining exceptionally high growth rates and rapid industrialization between the early 1960s and 1990s...
and that the economic boom in Ireland in the 1990s (the Celtic tiger
Celtic Tiger
Celtic Tiger is a term used to describe the economy of Ireland during a period of rapid economic growth between 1995 and 2007. The expansion underwent a dramatic reversal from 2008, with GDP contracting by 14% and unemployment levels rising to 14% by 2010...
) was in part due to the legalization of contraception in 1979
An Irish solution to an Irish problem
The availability of contraception in the Republic of Ireland was illegal in the Irish Free State from 1935 until 1980, when it was legalized with strong restrictions, later loosened...
and subsequent decline in the fertility rate. In Ireland the ratio of workers to dependents improved due to lower fertility but was raised further by increased female labor market participation and a reversal from outward migration of working age population to a net inflow. Africa, on the other hand continues to have high fertility and youth dependency rates, which contribute to its economic stagnation. The magnitude of the demographic dividend appears to be dependent on the ability of the economy to absorb and productively employ the extra workers, rather than be a pure demographic gift
Demographic gift
Demographic gift is a term in demographics used to describe the initially favorable effect of falling fertility rates on the age dependency ratio, the fraction of children and aged as compared to that of the working population.-Overview:...
.
Low fertility initially leads to low youth dependency and a high ratio of working age to total population. However as the relatively large working age cohort grows older, population aging sets in. The graph shows the ratio of working age to dependent population (those 15 to 64 years old, divided by those above or below this age range - the inverse of the dependency ratio
Dependency ratio
In economics and geography the dependency ratio is an age-population ratio of those typically not in the labor force and those typically in the labor force...
) based on data and projections from the United Nations.
See also
- Demographic transitionDemographic transitionThe demographic transition model is the transition from high birth and death rates to low birth and death rates as a country develops from a pre-industrial to an industrialized economic system. The theory is based on an interpretation of demographic history developed in 1929 by the American...
- Demographic trapDemographic trapAccording to the Encyclopedia of International Development, the term demographic trap is used by demographers "to describe the combination of high fertility and declining mortality in developing countries, resulting in a period of high population growth rate ." High fertility combined with...
- Demographic windowDemographic windowDemographic window is defined to be that period of time in a nation's demographic evolution when the proportion of population of working age group is particularly prominent. This occurs when the demographic architecture of a population becomes younger and the percentage of people able to work...
- Pensions crisisPensions crisisThe pensions crisis is a predicted difficulty in paying for corporate, state and federal pensions in the U.S. and Europe, due to a difference between pension obligations and the resources set aside to fund them. Shifting demographics are causing a lower ratio of workers per retiree, while retirees...