
Debugger
Encyclopedia
A debugger or debugging tool is a computer program
that is used to test and debug other programs (the "target" program). The code to be examined might alternatively be running on an instruction set simulator (ISS)
, a technique that allows great power in its ability to halt when specific conditions are encountered but which will typically be somewhat slower than executing the code directly on the appropriate (or the same) processor. Some debuggers offer two modes of operation - full or partial simulation, to limit this impact.
A "crash
" happens when the program cannot normally continue because of a programming bug
. For example, the program might have tried to use an instruction not available on the current version of the CPU
or attempted to access unavailable or protected
memory. When the program "crashes" or reaches a preset condition, the debugger typically shows the position in the original code if it is a source-level debugger or symbolic debugger, commonly now seen in integrated development environment
s. If it is a low-level debugger or a machine-language debugger it shows the line in the disassembly (unless it also has online access to the original source code and can display the appropriate section of code from the assembly or compilation).
Typically, debuggers also offer more sophisticated functions such as running a program step by step (single-stepping or program animation
), stopping (breaking) (pausing the program to examine the current state) at some event or specified instruction by means of a breakpoint
, and tracking the values of some variables. Some debuggers have the ability to modify the state of the program while it is running, rather than merely to observe it. It may also be possible to continue execution at a different location in the program to bypass a crash or logical error.
The importance of a good debugger cannot be overstated. Indeed, the existence and quality of such a tool for a given language and platform can often be the deciding factor in its use, even if another language/platform is better-suited to the task.. The absence of a debugger, having once been accustomed to using one, has been said to "make you feel like a blind man in a dark room looking for a black cat that isn’t there". However, software can (and often does) behave differently running under a debugger than normally, due to the inevitable changes the presence of a debugger will make to a software program's internal timing
. As a result, even with a good debugging tool, it is often very difficult to track down runtime problems in complex multi-threaded or distributed systems.
The same functionality which makes a debugger useful for eliminating bugs allows it to be used as a software cracking
tool to evade copy protection
, digital rights management
, and other software protection features. It often also makes it useful as a general testing verification tool test coverage and performance analyzer
, especially if instruction path length
s are shown.
Most current mainstream debugging engines, such as gdb and dbx
, provide console-based command line interfaces. Debugger front-ends are popular extensions to debugger engines that provide IDE integration, program animation
, and visualization features. Some early mainframe
debuggers such as Oliver and SIMON
provided this same functionality for the IBM System/360 and later operating systems, as long ago as the 1970s.
but calls assembly language
subroutines and PL/1 subroutines, the debugger may have to dynamically switch modes to accommodate the changes in language as they occur.
s such as buffer overflow
. This may be extremely important in transaction processing
environments where memory is dynamically allocated from memory 'pools' on a task by task basis.
to make debugging easier:
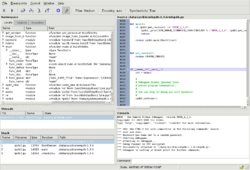
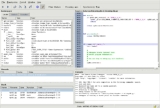
and minimize resource consumption. Debugging via a graphical user interface
(GUI) can be considered easier and more productive though. This is the reason for GUI debugger front-ends, that allow users to monitor and control subservient CLI-only debuggers via graphical user interface. Some GUI debugger front-ends are designed to be compatible with a variety of CLI-only debuggers, while others are targeted at one specific debugger.
Computer program
A computer program is a sequence of instructions written to perform a specified task with a computer. A computer requires programs to function, typically executing the program's instructions in a central processor. The program has an executable form that the computer can use directly to execute...
that is used to test and debug other programs (the "target" program). The code to be examined might alternatively be running on an instruction set simulator (ISS)
Instruction Set Simulator
An instruction set simulator is a simulation model, usually coded in a high-level programming language, which mimics the behavior of a mainframe or microprocessor by "reading" instructions and maintaining internal variables which represent the processor's registers.Instruction simulation is a...
, a technique that allows great power in its ability to halt when specific conditions are encountered but which will typically be somewhat slower than executing the code directly on the appropriate (or the same) processor. Some debuggers offer two modes of operation - full or partial simulation, to limit this impact.
A "crash
Crash (computing)
A crash in computing is a condition where a computer or a program, either an application or part of the operating system, ceases to function properly, often exiting after encountering errors. Often the offending program may appear to freeze or hang until a crash reporting service documents...
" happens when the program cannot normally continue because of a programming bug
Software bug
A software bug is the common term used to describe an error, flaw, mistake, failure, or fault in a computer program or system that produces an incorrect or unexpected result, or causes it to behave in unintended ways. Most bugs arise from mistakes and errors made by people in either a program's...
. For example, the program might have tried to use an instruction not available on the current version of the CPU
Central processing unit
The central processing unit is the portion of a computer system that carries out the instructions of a computer program, to perform the basic arithmetical, logical, and input/output operations of the system. The CPU plays a role somewhat analogous to the brain in the computer. The term has been in...
or attempted to access unavailable or protected
Memory protection
Memory protection is a way to control memory access rights on a computer, and is a part of most modern operating systems. The main purpose of memory protection is to prevent a process from accessing memory that has not been allocated to it. This prevents a bug within a process from affecting...
memory. When the program "crashes" or reaches a preset condition, the debugger typically shows the position in the original code if it is a source-level debugger or symbolic debugger, commonly now seen in integrated development environment
Integrated development environment
An integrated development environment is a software application that provides comprehensive facilities to computer programmers for software development...
s. If it is a low-level debugger or a machine-language debugger it shows the line in the disassembly (unless it also has online access to the original source code and can display the appropriate section of code from the assembly or compilation).
Typically, debuggers also offer more sophisticated functions such as running a program step by step (single-stepping or program animation
Program animation
Program animation or Stepping refers to the very common debugging method of executing code one "line" at a time. The programmer may examine the state of the program, machine, and related data before and after execution of a particular line of code...
), stopping (breaking) (pausing the program to examine the current state) at some event or specified instruction by means of a breakpoint
Breakpoint
In software development, a breakpoint is an intentional stopping or pausing place in a program, put in place for debugging purposes. It is also sometimes simply referred to as a pause....
, and tracking the values of some variables. Some debuggers have the ability to modify the state of the program while it is running, rather than merely to observe it. It may also be possible to continue execution at a different location in the program to bypass a crash or logical error.
The importance of a good debugger cannot be overstated. Indeed, the existence and quality of such a tool for a given language and platform can often be the deciding factor in its use, even if another language/platform is better-suited to the task.. The absence of a debugger, having once been accustomed to using one, has been said to "make you feel like a blind man in a dark room looking for a black cat that isn’t there". However, software can (and often does) behave differently running under a debugger than normally, due to the inevitable changes the presence of a debugger will make to a software program's internal timing
Timing
Timing is the time when something happens or the spacing of events in time. Some typical uses are:* The act of measuring the elapsed time of something or someone, often at athletic events such as swimming or running, where participants are timed with a device such as a stopwatch...
. As a result, even with a good debugging tool, it is often very difficult to track down runtime problems in complex multi-threaded or distributed systems.
The same functionality which makes a debugger useful for eliminating bugs allows it to be used as a software cracking
Software cracking
Software cracking is the modification of software to remove or disable features which are considered undesirable by the person cracking the software, usually related to protection methods: copy protection, trial/demo version, serial number, hardware key, date checks, CD check or software annoyances...
tool to evade copy protection
Copy protection
Copy protection, also known as content protection, copy obstruction, copy prevention and copy restriction, refer to techniques used for preventing the reproduction of software, films, music, and other media, usually for copyright reasons.- Terminology :Media corporations have always used the term...
, digital rights management
Digital rights management
Digital rights management is a class of access control technologies that are used by hardware manufacturers, publishers, copyright holders and individuals with the intent to limit the use of digital content and devices after sale. DRM is any technology that inhibits uses of digital content that...
, and other software protection features. It often also makes it useful as a general testing verification tool test coverage and performance analyzer
Performance analysis
In software engineering, profiling is a form of dynamic program analysis that measures, for example, the usage of memory, the usage of particular instructions, or frequency and duration of function calls...
, especially if instruction path length
Instruction path length
In computer performance, the instruction path length is the number of machine code instructions required to execute a section of a computer program. The total path length for the entire program could be deemed a measure of the algorithm's performance on a particular computer hardware...
s are shown.
Most current mainstream debugging engines, such as gdb and dbx
Dbx debugger
DBX is a proprietary source-level debugger found primarily on Solaris, AIX, IRIX, Tru64 UNIX, GNU/Linux and BSD operating systems. It provides symbolic debugging for programs written in C, C++, Pascal, Fortran and Java. Useful features include stepping through programs one source line or machine...
, provide console-based command line interfaces. Debugger front-ends are popular extensions to debugger engines that provide IDE integration, program animation
Program animation
Program animation or Stepping refers to the very common debugging method of executing code one "line" at a time. The programmer may examine the state of the program, machine, and related data before and after execution of a particular line of code...
, and visualization features. Some early mainframe
Mainframe computer
Mainframes are powerful computers used primarily by corporate and governmental organizations for critical applications, bulk data processing such as census, industry and consumer statistics, enterprise resource planning, and financial transaction processing.The term originally referred to the...
debuggers such as Oliver and SIMON
SIMON (Batch Interactive test/debug)
SIMON was a proprietary test/debugging toolkit for interactively testing Batch programs designed to run on IBM's System 360/370/390 architecture....
provided this same functionality for the IBM System/360 and later operating systems, as long ago as the 1970s.
Language dependency
Some debuggers operate on a single specific language while others can handle multiple languages transparently. For example if the main target program is written in COBOLCOBOL
COBOL is one of the oldest programming languages. Its name is an acronym for COmmon Business-Oriented Language, defining its primary domain in business, finance, and administrative systems for companies and governments....
but calls assembly language
Assembly language
An assembly language is a low-level programming language for computers, microprocessors, microcontrollers, and other programmable devices. It implements a symbolic representation of the machine codes and other constants needed to program a given CPU architecture...
subroutines and PL/1 subroutines, the debugger may have to dynamically switch modes to accommodate the changes in language as they occur.
Memory protection
Some debuggers also incorporate memory protection to avoid storage violationStorage violation
A storage violation occurs when a task modifies, or attempts to modify, computer storage that it does not own.-Types of storage violation:Storage violation can, for instance, consist of writing to or freeing storage not owned by the task....
s such as buffer overflow
Buffer overflow
In computer security and programming, a buffer overflow, or buffer overrun, is an anomaly where a program, while writing data to a buffer, overruns the buffer's boundary and overwrites adjacent memory. This is a special case of violation of memory safety....
. This may be extremely important in transaction processing
Transaction processing
In computer science, transaction processing is information processing that is divided into individual, indivisible operations, called transactions. Each transaction must succeed or fail as a complete unit; it cannot remain in an intermediate state...
environments where memory is dynamically allocated from memory 'pools' on a task by task basis.
Hardware support for debugging
Most modern microprocessors have at least one of these features in their CPU designCPU design
CPU design is the design engineering task of creating a central processing unit , a component of computer hardware. It is a subfield of electronics engineering and computer engineering.- Overview :CPU design focuses on these areas:...
to make debugging easier:
- hardware support for single-stepping a program, such as the trap flagTrap flagA trap flag permits operation of a processor in single-step mode. If such a flag is available, debuggers can use it to step through the execution of a computer program.-Single-step interrupt:...
. - An instruction set that meets the Popek and Goldberg virtualization requirementsPopek and Goldberg virtualization requirementsThe Popek and Goldberg virtualization requirements are a set of conditions sufficient for a computer architecture to support system virtualization efficiently. They were introduced by Gerald J. Popek and Robert P. Goldberg in their 1974 article "Formal Requirements for Virtualizable Third...
makes it easier to write debugger software that runs on the same CPU as the software being debugged; such a CPU can execute the inner loops of the program under test at full speed, and still remain under the control of the debugger. - In-System ProgrammingIn-System ProgrammingIn-System Programming is the ability of some programmable logic devices, microcontrollers, and other programmable electronic chips to be programmed while installed in a complete system, rather than requiring the chip to be programmed prior to installing it into the system.The primary advantage of...
allows an external hardware debugger to re-program a system under test (for example, adding or removing instruction breakpoints). Many systems with such ISP support also have other hardware debug support. - Hardware support for code and data breakpointBreakpointIn software development, a breakpoint is an intentional stopping or pausing place in a program, put in place for debugging purposes. It is also sometimes simply referred to as a pause....
s, such as address comparators and data value comparators or, with considerably more work involved, page faultPage faultA page fault is a trap to the software raised by the hardware when a program accesses a page that is mapped in the virtual address space, but not loaded in physical memory. In the typical case the operating system tries to handle the page fault by making the required page accessible at a location...
hardware. - JTAG access to hardware debug interfaces such as those on ARM architectureARM architectureARM is a 32-bit reduced instruction set computer instruction set architecture developed by ARM Holdings. It was named the Advanced RISC Machine, and before that, the Acorn RISC Machine. The ARM architecture is the most widely used 32-bit ISA in numbers produced...
processors or using the Nexus command set. Processors used in embedded systems typically have extensive JTAG debug support. - Microcontrollers with as few as six pins need to use low pin-count substitutes for JTAG, such as BDMBackground Debug Mode interfaceBackground Debug Mode interface is an electronic interface that allows debugging of embedded systems. Specifically, it provides in-circuit debugging functionality in microcontrollers...
, Spy-Bi-WireSpy-Bi-WireSpy-Bi-Wire is a serialised JTAG protocol developed by Texas Instruments for their MSP430 micro controllers.In this protocol only two connections are used instead of the usual four pins for the general JTAG interface. The two connections are a bidirectional data output, and a clock...
, or DebugWire on the Atmel AVRAtmel AVRThe AVR is a modified Harvard architecture 8-bit RISC single chip microcontroller which was developed by Atmel in 1996. The AVR was one of the first microcontroller families to use on-chip flash memory for program storage, as opposed to one-time programmable ROM, EPROM, or EEPROM used by other...
. DebugWire, for example, uses bidirectional signaling on the RESET pin.
List of debuggers
- AppPuncher Debugger — for debugging Rich Internet Applications
- AQtimeAQtimeAQtime is a performance profiler and memory/resource debugging toolset developed by SmartBear Software. It is integrated into Microsoft Visual Studio, Visual Studio Test Projects and Embarcadero RAD Studio that allows analyzing the application without leaving the development environment.- Overview...
- ARM Development Studio 5 (DS-5)
- CA/EZTESTCA/EZTESTCA/EZTEST was a CICS interactive test/debug software package distributed by Computer Associates and originally called EZTEST/CICS, produced by Capex Corporation of Phoenix, Arizona with assistance from Ken Dakin from England....
— was a CICSCICSCustomer Information Control System is a transaction server that runs primarily on IBM mainframe systems under z/OS and z/VSE.CICS is a transaction manager designed for rapid, high-volume online processing. This processing is mostly interactive , but background transactions are possible...
interactive test/debug software package - CodeViewCodeViewCodeView was a standalone debugger created by David Norris at Microsoft in 1985 as part of its development toolset. It originally shipped with Microsoft C 4.0 and later. It also shipped with Visual Basic for MS-DOS, Microsoft Basic PDS, and a number of other Microsoft language products...
- DBGDbgDBG is an open source debugger and profiler for the PHP programming language. It is the debugger used in NuSphere's PhpED .-Features:* Remote and local debugging* Explicit and implicit activation...
— a PHP Debugger and Profiler - dbxDbx debuggerDBX is a proprietary source-level debugger found primarily on Solaris, AIX, IRIX, Tru64 UNIX, GNU/Linux and BSD operating systems. It provides symbolic debugging for programs written in C, C++, Pascal, Fortran and Java. Useful features include stepping through programs one source line or machine...
- DDDData Display DebuggerData Display Debugger, or DDD, is a popular free software graphical user interface for command-line debuggers such as GDB, DBX, JDB, , XDB, the Perl debugger, the Bash , the Python , and the GNU Make...
(Data Display Debugger) - Distributed Debugging Tool (Allinea DDT)
- DDTLite — Allinea DDTLite for Visual Studio 2008
- DEBUG — the built-in debugger of DOS and Microsoft Windows
- Opera DragonflyOpera DragonflyOpera Dragonfly is a full-featured development and debugging tool integrated into the Opera browser.It supports debugging JavaScript, viewing the DOM, monitoring network traffic, previewing resources, editing colors, etc...
- Dynamic debugging techniqueDynamic debugging techniqueDynamic Debugging Technique, or DDT, was the name of several debugger programs originally developed for DEC hardware, initially known as DEC Debugging Tape because it was distributed on paper tape. The name is a pun on the insecticide Dynamic Debugging Technique, or DDT, was the name of several...
(DDT), and its octal counterpart Octal Debugging TechniqueOctal Debugging TechniqueOn-line Debugging Tool, or ODT, was the name of several debugger programs originally developed for DEC hardware. Various operating systems including OS/8, RT-11, RSX-11, and RSTS/E implemented ODT as did the firmware console of all of the LSI-11-family processors including the 11/03, 11/23/24,... - EclipseEclipse (software)Eclipse is a multi-language software development environment comprising an integrated development environment and an extensible plug-in system...
- Embedded System Debug Plug-in for EclipseEmbedded System Debug Plug-in for EclipseThe Embedded system debug Plug-ins for Eclipse allow developers to use Eclipse as their integrated development environment when debugging an embedded system based on different microcontrollers....
- FusionDebugFusionDebugFusionDebug an interactive step debugger for Adobe ColdFusion and Railo CFML Engine. Step through code line-by-line, step into, step over or out of code to better understand how CFML code is running...
- GNU DebuggerGNU DebuggerThe GNU Debugger, usually called just GDB and named gdb as an executable file, is the standard debugger for the GNU software system. It is a portable debugger that runs on many Unix-like systems and works for many programming languages, including Ada, C, C++, Objective-C, Free Pascal, Fortran, Java...
(GDB) - Intel DebuggerIntel DebuggerThe Intel Debugger , developed by Intel Corporation provides support for debugging programs written in C, C++, and Fortran ....
(IDB) - InsightInsight DebuggerInsight is real-mode debugger for DOS. It includes i80486 disassembler, i8086 assembler, trace-into and step-over functions, breakpoint handling, and a user-friendly interface....
- Parasoft Insure++Insure++Insure++ is a memory debugger computer program, used by software developers to detect various errors in programs written in C and C++. It is made by Parasoft, and is functionally similar to other memory debuggers, such as Purify and Valgrind.-Overview:...
- iSYSTEM — in-circuit debugger for embedded systemEmbedded systemAn embedded system is a computer system designed for specific control functions within a larger system. often with real-time computing constraints. It is embedded as part of a complete device often including hardware and mechanical parts. By contrast, a general-purpose computer, such as a personal...
s - Interactive DisassemblerInteractive DisassemblerThe Interactive Disassembler, more commonly known as simply IDA, is a disassembler for computer software which generates assembly language source code from machine-executable code. It supports a variety of executable formats for different processors and operating systems. It also can be used as a...
(IDA Pro) - Java Platform Debugger ArchitectureJava Platform Debugger ArchitectureThe Java Platform Debugger Architecture is a collection of APIs to debug Java code.* Java Debugger Interface - defines a high-level Java language interface which developers can easily use to write remote debugger application tools....
- JinxJinx DebuggerJinx is a concurrency debugger that deterministically controls the interleaving of workloads across processor cores, focusing on shared memory interactions. Using this deterministic approach, Jinx is able to increase the frequency of occurrence of elusive shared memory bugs, sometimes called...
— a whole-system debugger for heisenbugs. It works transparently as a device driver. - JSwatJSwatJSwat is a graphical Java debugger front-end, written to use the Java Platform Debugger Architecture. JSwat is licensed under the Common Development and Distribution License and is freely available in both binary and source code form...
— open-source Java debugger - LLDBLLDB (debugger)The LLDB Debugger is a high-performance debugger. It is built as a set of reusable components which highly leverage existing libraries in the larger LLVM Project, such as the Clang expression parser and LLVM disassembler.-Current State:...
- MacsBugMacsBugMacsBug is a low-level debugger for pre-Mac OS X Macintosh operating systems. MacsBug is an acronym for Motorola Advanced Computer Systems Debugger, as opposed to Macintosh debugger...
- NemiverNemiverNemiver is a standalone graphical C and C++ debugger that integrates in the GNOME desktop environment.It currently features a backend which uses the well known GNU Debugger .The creator and the current lead developer is Dodji Seketeli.- General :...
— graphical C/C++ debugger for the GNOME desktop environmentGNOMEGNOME is a desktop environment and graphical user interface that runs on top of a computer operating system. It is composed entirely of free and open source software... - OLIVER (CICS interactive test/debug)OLIVER (CICS interactive test/debug)OLIVER was a proprietary testing and debugging toolkit for interactively testing programs designed to run on IBM's Customer Information Control System on IBM's System/360/370/390 architecture.-History:...
- a GUI equipped instruction set simulator (ISS)Instruction Set SimulatorAn instruction set simulator is a simulation model, usually coded in a high-level programming language, which mimics the behavior of a mainframe or microprocessor by "reading" instructions and maintaining internal variables which represent the processor's registers.Instruction simulation is a... - OllyDbgOllyDbgOllyDbg is an x86 debugger that emphasizes binary code analysis, which is useful when source code is not available. It traces registers, recognizes procedures, API calls, switches, tables, constants and strings, as well as locates routines from object files and libraries. Version 1.10 is the final...
- Omniscient DebuggerOmniscient DebuggerThe Omniscient Debugger, or ODB for short, is a Java programming language debugger which lets users step backwards in time. It allows this by keeping track of all changes to objects and variables made as a program runs. It is free open source software, released under the GPL license.- External...
— Forward and backward debugger for Java - pgdbg — parallel graphical symbolic debugger for C/C++/Fortran on Linux/Windows/Mac developed by The Portland Group
- pydbg
- IBM Rational Purify
- RealView Debugger — Commercial debugger produced for and designed by ARM
- sdb
- SIMMONSIMMONSIMMON was a proprietary software testing system developed in the late 1960s in the IBM Product Test Laboratory, then at Poughkeepsie, N.Y...
(Simulation Monitor) - SIMON (Batch Interactive test/debug)SIMON (Batch Interactive test/debug)SIMON was a proprietary test/debugging toolkit for interactively testing Batch programs designed to run on IBM's System 360/370/390 architecture....
— a GUI equipped instruction set simulator (ISS)Instruction Set SimulatorAn instruction set simulator is a simulation model, usually coded in a high-level programming language, which mimics the behavior of a mainframe or microprocessor by "reading" instructions and maintaining internal variables which represent the processor's registers.Instruction simulation is a...
for batch - SoftICESoftICESoftICE is a kernel mode debugger for Microsoft Windows. Crucially, it is designed to run underneath Windows such that the operating system is unaware of its presence. Unlike an application debugger, SoftICE is capable of suspending all operations in Windows when instructed...
- TimeMachine — Forward and backward debugger designed by Green Hills SoftwareGreen Hills SoftwareGreen Hills Software is a privately owned company that builds operating systems and development tools for embedded systems. The company was founded in 1982 by Dan O'Dowd and Carl Rosenberg...
- TotalViewTotalViewTotalView is a proprietary debugger for C/C++ and Fortran code that runs on Unix-like operating systems such as Linux and Mac OS X systems, on several platforms....
- Lauterbach TRACE32 — in-circuit debugger for embedded SystemEmbedded systemAn embedded system is a computer system designed for specific control functions within a larger system. often with real-time computing constraints. It is embedded as part of a complete device often including hardware and mechanical parts. By contrast, a general-purpose computer, such as a personal...
s - Turbo DebuggerTurbo DebuggerTurbo Debugger was a machine-level debugger for MS-DOS executables, intended mainly for debugging Borland Turbo Pascal , and later Turbo C programs, sold by Borland...
- UpsUps (debugger)Ups is an open source source-level debugger developed in the late 1980s for Unix and Unix-like systems, originally developed at the University of Kent by Mark Russell...
— C, Fortran source level debugger - ValgrindValgrindValgrind is a GPL licensed programming tool for memory debugging, memory leak detection, and profiling. The name valgrind comes from the main entrance to Valhalla in Norse mythology....
- VB Watch DebuggerVB WatchVB Watch is a Visual Basic programming utility. VB Watch consists of three tools for Visual Basic 6.0: Profiler, Protector and Debugger.-Profiler:...
— debugger for Visual Basic 6.0 - Microsoft Visual Studio DebuggerMicrosoft Visual Studio DebuggerThe Microsoft Visual Studio Debugger is a debugger that ships along with all versions of Microsoft Visual Studio. This debugger owes much of its feel and functionality to CodeView, a standalone, text-based debugger that shipped with Microsoft Visual C++ version 1.5 and earlier.More advanced...
- WinDbgWinDbgWinDbg is a multipurposed debugger for Microsoft Windows, distributed on the web by Microsoft. It can be used to debug user mode applications, drivers, and the operating system itself in kernel mode...
- XdebugXdebugXdebug is a PHP extension which provides debugging and profiling capabilities. It uses the DBGp debugging protocol.The debug information that Xdebug can provide includes the following:* stack and function traces in error messages with:...
— PHP debugger and profiler
Debugger front-ends
Some of the most capable and popular debuggers only implement a simple command line interface (CLI) — often to maximize portabilityPorting
In computer science, porting is the process of adapting software so that an executable program can be created for a computing environment that is different from the one for which it was originally designed...
and minimize resource consumption. Debugging via a graphical user interface
Graphical user interface
In computing, a graphical user interface is a type of user interface that allows users to interact with electronic devices with images rather than text commands. GUIs can be used in computers, hand-held devices such as MP3 players, portable media players or gaming devices, household appliances and...
(GUI) can be considered easier and more productive though. This is the reason for GUI debugger front-ends, that allow users to monitor and control subservient CLI-only debuggers via graphical user interface. Some GUI debugger front-ends are designed to be compatible with a variety of CLI-only debuggers, while others are targeted at one specific debugger.
List of debugger front-ends
- Many Integrated development environmentIntegrated development environmentAn integrated development environment is a software application that provides comprehensive facilities to computer programmers for software development...
s come with integrated debuggers (or front-ends to standard debuggers).- Many EclipseEclipse (software)Eclipse is a multi-language software development environment comprising an integrated development environment and an extensible plug-in system...
perspectives, e.g. the Java Development Tools (JDT) http://www.eclipse.org/jdt/index.php, provide a debugger front-end.
- Many Eclipse
- DDDData Display DebuggerData Display Debugger, or DDD, is a popular free software graphical user interface for command-line debuggers such as GDB, DBX, JDB, , XDB, the Perl debugger, the Bash , the Python , and the GNU Make...
is the standard front-end from the GNU ProjectGNU ProjectThe GNU Project is a free software, mass collaboration project, announced on September 27, 1983, by Richard Stallman at MIT. It initiated GNU operating system development in January, 1984...
. It is a complex tool that works with most common debuggers (GDB, jdb, Python debugger, Perl debugger, Tcl, and others) natively or with some external programs (for PHP). - GDB (the GNU debugger) GUI
- EmacsEmacsEmacs is a class of text editors, usually characterized by their extensibility. GNU Emacs has over 1,000 commands. It also allows the user to combine these commands into macros to automate work.Development began in the mid-1970s and continues actively...
— Emacs editor with built in support for the GNU Debugger acts as the frontend. - KDbgKDbgKDbg is an open source graphical front-end for the GNU Debugger. KDbg is implemented using the KDE component architecture.- See also :* Data Display Debugger , a Motif debugger front-end* ups...
— Part of the KDE development tools. - NemiverNemiverNemiver is a standalone graphical C and C++ debugger that integrates in the GNOME desktop environment.It currently features a backend which uses the well known GNU Debugger .The creator and the current lead developer is Dodji Seketeli.- General :...
— A GDB frontend that integrates well in the GNOMEGNOMEGNOME is a desktop environment and graphical user interface that runs on top of a computer operating system. It is composed entirely of free and open source software...
desktop environment. - xxgdbXxgdbXxgdb is an open source X Window System front-end for gdb. It was adapted from xdbx, which uses the dbx debugger.- See also :* Data Display Debugger , a Motif front-end.* KDbg, a KDE debugger front-end.* ups ....
— X-window frontend for GDB and dbx debuggerDbx debuggerDBX is a proprietary source-level debugger found primarily on Solaris, AIX, IRIX, Tru64 UNIX, GNU/Linux and BSD operating systems. It provides symbolic debugging for programs written in C, C++, Pascal, Fortran and Java. Useful features include stepping through programs one source line or machine...
. - Qt Creator — multi-platform frontend for GDB and CDB (debugging example).
- cgdb — ncurses terminal program that mimics vimVim (text editor)Vim is a text editor written by Bram Moolenaar and first released publicly in 1991. Based on the vi editor common to Unix-like systems, Vim is designed for use both from a command line interface and as a standalone application in a graphical user interface...
key mapping. - ccdebug— A graphical GDB frontend using the Qt toolkit.
- Padb — has a parallel front-end to GDB allowing it to target parallel applications.
- Allinea's DDT — a parallel and distributed front-end to a modified version of GDB.
- XcodeXcodeXcode is a suite of tools, developed by Apple, for developing software for Mac OS X and iOS. Xcode 4.2, the latest major version, is available on the Mac App Store for free for Mac OS X 10.7 , and on the Apple Developer Connection website for free to registered developers Xcode is a suite of tools,...
— contains a GDB front-end as well. - SlickEditSlickEditSlickEdit, previously known as Visual SlickEdit, is a cross-platform commercial source code editor by SlickEdit, Inc. SlickEdit provides syntax highlighting, code navigation and customizable keyboard shortcuts. Versions from 2007 and later also support programmable code...
— contains a GDB front-end as well. - EclipseEclipse (software)Eclipse is a multi-language software development environment comprising an integrated development environment and an extensible plug-in system...
C/C++ Development Tools (CDT) http://www.eclipse.org/cdt/ — includes visual debugging tools based on GDB.
- Emacs