

Correlogram
Encyclopedia

Autocorrelation
Autocorrelation is the cross-correlation of a signal with itself. Informally, it is the similarity between observations as a function of the time separation between them...
s
 versus
  (the time lags).
If cross-correlation
Cross-correlation
In signal processing, cross-correlation is a measure of similarity of two waveforms as a function of a time-lag applied to one of them. This is also known as a sliding dot product or sliding inner-product. It is commonly used for searching a long-duration signal for a shorter, known feature...
is used, the result is called a cross-correlogram. The correlogram is a commonly used tool for checking randomness
Randomness
Randomness has somewhat differing meanings as used in various fields. It also has common meanings which are connected to the notion of predictability of events....
in a data set
Data set
A data set is a collection of data, usually presented in tabular form. Each column represents a particular variable. Each row corresponds to a given member of the data set in question. Its values for each of the variables, such as height and weight of an object or values of random numbers. Each...
. This randomness is ascertained by computing autocorrelations for data values at varying time lags. If random, such autocorrelations should be near zero for any and all time-lag separations. If non-random, then one or more of the autocorrelations will be significantly non-zero.
In addition, correlograms are used in the model identification stage for Box–Jenkins autoregressive moving average time series
Time series
In statistics, signal processing, econometrics and mathematical finance, a time series is a sequence of data points, measured typically at successive times spaced at uniform time intervals. Examples of time series are the daily closing value of the Dow Jones index or the annual flow volume of the...
models. Autocorrelations should be near-zero for randomness; if the analyst does not check for randomness, then the validity of many of the statistical conclusions becomes suspect. The correlogram is an excellent way of checking for such randomness.
Applications
The correlogram can help provide answers to the following questions:- Are the data random?
- Is an observation related to an adjacent observation?
- Is an observation related to an observation twice-removed? (etc.)
- Is the observed time series white noiseWhite noiseWhite noise is a random signal with a flat power spectral density. In other words, the signal contains equal power within a fixed bandwidth at any center frequency...
? - Is the observed time series sinusoidal?
- Is the observed time series autoregressive?
- What is an appropriate model for the observed time series?
- Is the model

valid and sufficient?- Is the formula
 valid?
Importance
Randomness (along with fixed model, fixed variation, and fixed distribution) is one of the four assumptions that typically underlie all measurement processes. The randomness assumption is critically important for the following three reasons:- Most standard statistical tests depend on randomness. The validity of the test conclusions is directly linked to the validity of the randomness assumption.
- Many commonly-used statistical formulae depend on the randomness assumption, the most common formula being the formula for determining the standard deviation of the sample mean:

where s is the standard deviationStandard deviationStandard deviation is a widely used measure of variability or diversity used in statistics and probability theory. It shows how much variation or "dispersion" there is from the average...
of the data. Although heavily used, the results from using this formula are of no value unless the randomness assumption holds.- For univariate data, the default model is

If the data are not random, this model is incorrect and invalid, and the estimates for the parameters (such as the constant) become nonsensical and invalid.
Estimation of autocorrelations
The autocorrelation coefficient at lag h is given by
where ch is the autocovariance function
and c0 is the variance function
The resulting value of rh will range between -1 and +1.
Alternate estimate
Some sources may use the following formula for the autocovariance function:
Although this definition has less biasBias of an estimatorIn statistics, bias of an estimator is the difference between this estimator's expected value and the true value of the parameter being estimated. An estimator or decision rule with zero bias is called unbiased. Otherwise the estimator is said to be biased.In ordinary English, the term bias is...
, the (1/N) formulation has some desirable statistical properties and is the form most commonly used in the statistics literature. See pages 20 and 49-50 in Chatfield for details.
Statistical inference with correlograms
In the same graph one can draw upper and lower bounds for autocorrelation with significance level :
:
 with
with  as the estimated autocorrelation at lag
  .
.
If the autocorrelation is higher (lower) than this upper (lower) bound, the null hypothesis that there is no autocorrelation at and beyond a given lag is rejected at a significance level of . This test is an approximate one and assumes that the time-series is GaussianGAUSSIANGaussian is a computational chemistry software program initially released in 1970 by John Pople and his research group at Carnegie-Mellon University as Gaussian 70. It has been continuously updated since then...
.
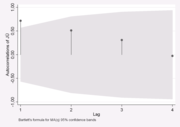
In the above, z1-α/2 is the quantile of the normal distribution; SE is the standard error, which can be computed by BartlettM. S. BartlettMaurice Stevenson Bartlett FRS was an English statistician who made particular contributions to the analysis of data with spatial and temporal patterns...
's formula for MA(l) processes:

 for
for 
In the picture above we can reject the null hypothesisNull hypothesisThe practice of science involves formulating and testing hypotheses, assertions that are capable of being proven false using a test of observed data. The null hypothesis typically corresponds to a general or default position...
that there is no autocorrelation between time-points which are adjacent (lag=1). For the other periods one cannot reject the null hypothesisNull hypothesisThe practice of science involves formulating and testing hypotheses, assertions that are capable of being proven false using a test of observed data. The null hypothesis typically corresponds to a general or default position...
of no autocorrelation.
Note that there are two distinct formulas for generating the confidence bands:
1. If the correlogram is being used to test for randomness (i.e., there is no time dependence in the data), the following formula is recommended:
where N is the sample sizeSample sizeSample size determination is the act of choosing the number of observations to include in a statistical sample. The sample size is an important feature of any empirical study in which the goal is to make inferences about a population from a sample...
, z is the quantile functionQuantile functionIn probability and statistics, the quantile function of the probability distribution of a random variable specifies, for a given probability, the value which the random variable will be at, or below, with that probability...
of the standard normal distribution and α is the significance level. In this case, the confidence bands have fixed width that depends on the sample size.
2. Correlograms are also used in the model identification stage for fitting ARIMAArimaThe Royal Borough of Arima is the fourth largest town in Trinidad and Tobago. Located east of the capital, Port of Spain, Arima supports the only organised indigenous community in the country, the Santa Rosa Carib Community and is the seat of the Carib Queen...
models. In this case, a moving average modelMoving average modelIn time series analysis, the moving-average model is a common approach for modeling univariate time series models. The notation MA refers to the moving average model of order q:...
is assumed for the data and the following confidence bands should be generated:
where k is the lag. In this case, the confidence bands increase as the lag increases.
Software
Correlograms are available in most general purpose statistical software programs. In RR (programming language)R is a programming language and software environment for statistical computing and graphics. The R language is widely used among statisticians for developing statistical software, and R is widely used for statistical software development and data analysis....
, the function acf and pacf can be used to produce such a plot.
Related techniques
- Partial autocorrelation plot
- Lag plot
- Spectral plot
- Seasonal subseries plotSeasonal subseries plotSeasonal subseries plots are a tool for detecting seasonality in a time series. This plot allows one to detect both between-group and within-group patterns. This plot is only useful if the period of the seasonality is already known. In many cases, this will in fact be known. For example, monthly...
External links
- For univariate data, the default model is
- Is the formula