
.gif)
Coherence (signal processing)
Encyclopedia
Background
The spectralFrequency domain
In electronics, control systems engineering, and statistics, frequency domain is a term used to describe the domain for analysis of mathematical functions or signals with respect to frequency, rather than time....
coherence is a statistic
Statistic
A statistic is a single measure of some attribute of a sample . It is calculated by applying a function to the values of the items comprising the sample which are known together as a set of data.More formally, statistical theory defines a statistic as a function of a sample where the function...
that can be used to examine the relation between two signals
Signal (electrical engineering)
In the fields of communications, signal processing, and in electrical engineering more generally, a signal is any time-varying or spatial-varying quantity....
or data
Data
The term data refers to qualitative or quantitative attributes of a variable or set of variables. Data are typically the results of measurements and can be the basis of graphs, images, or observations of a set of variables. Data are often viewed as the lowest level of abstraction from which...
sets. It is commonly used to estimate the power
Power (physics)
In physics, power is the rate at which energy is transferred, used, or transformed. For example, the rate at which a light bulb transforms electrical energy into heat and light is measured in watts—the more wattage, the more power, or equivalently the more electrical energy is used per unit...
transfer between input and output of a linear system
Linear system
A linear system is a mathematical model of a system based on the use of a linear operator.Linear systems typically exhibit features and properties that are much simpler than the general, nonlinear case....
. If the signals are ergodic
Ergodic process
In signal processing, a stochastic process is said to be ergodic if its statistical properties can be deduced from a single, sufficiently long sample of the process.- Specific definitions :...
, and the system function
Transfer function
A transfer function is a mathematical representation, in terms of spatial or temporal frequency, of the relation between the input and output of a linear time-invariant system. With optical imaging devices, for example, it is the Fourier transform of the point spread function i.e...
linear
Linear system
A linear system is a mathematical model of a system based on the use of a linear operator.Linear systems typically exhibit features and properties that are much simpler than the general, nonlinear case....
, it can be used to estimate the causality
Causality
Causality is the relationship between an event and a second event , where the second event is understood as a consequence of the first....
between the input and output.
Definition and Formulation
The coherence (sometimes called magnitude-squared coherence) between two signals x(t) and y(t) is a realReal number
In mathematics, a real number is a value that represents a quantity along a continuum, such as -5 , 4/3 , 8.6 , √2 and π...
-valued function that is defined as :

where Gxy is the cross-spectral density
Spectral density
In statistical signal processing and physics, the spectral density, power spectral density , or energy spectral density , is a positive real function of a frequency variable associated with a stationary stochastic process, or a deterministic function of time, which has dimensions of power per hertz...
between x and y, and Gxx and Gyy the autospectral density of x and y respectively. The magnitude
Magnitude (mathematics)
The magnitude of an object in mathematics is its size: a property by which it can be compared as larger or smaller than other objects of the same kind; in technical terms, an ordering of the class of objects to which it belongs....
of the spectral density is denoted as |G|. Given the restrictions noted above (ergodicity, linearity) the coherence function estimates the extent to which y(t) may be predicted from x(t) by an optimum linear least squares
Least squares
The method of least squares is a standard approach to the approximate solution of overdetermined systems, i.e., sets of equations in which there are more equations than unknowns. "Least squares" means that the overall solution minimizes the sum of the squares of the errors made in solving every...
function.
Values of coherence will always satisfy
 . For a constant parameter linear system with a single input x(t) and single output y(t), the coherence will be equal to one. If the system's impulse response is h(t) (
 , where * denotes convolution
Convolution
In mathematics and, in particular, functional analysis, convolution is a mathematical operation on two functions f and g, producing a third function that is typically viewed as a modified version of one of the original functions. Convolution is similar to cross-correlation...
), then
 , where Y(f) is the Fourier transform of y(t). Since
  and
and  , and since
  is real,
-
 .
.
If x(t) and y(t) are completely unrelated the coherence will be zero. If Cxy is less than one but greater than zero it is an indication that either: noise is entering the measurements, that the assumed function relating x(t) and y(t) is not linear, or that y(t) is producing output due to input x(t) as well as other inputs.
The coherence of a linear system therefore represents the fractional part of the output signal power that is produced by the input at that frequency. We can also view the quantity
 as an estimate of the fractional power of the output that is not contributed by the input at a particular frequency. This leads naturally to definition of the coherent output spectrum:
 provides a spectral quantification of the output power that is uncorrelated with noise or other inputs.
Example
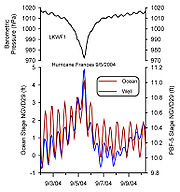
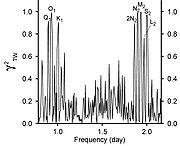
Figure 2. shows the autospectral density of ocean water level over a long period of time.
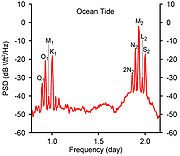
Tide
Tides are the rise and fall of sea levels caused by the combined effects of the gravitational forces exerted by the moon and the sun and the rotation of the Earth....
frequencies. Likewise, the autospectral density of groundwater well levels are shown in figure 3.
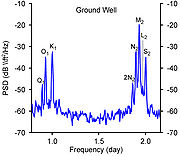
The computed coherence is shown in figure 4 (note that coherence is often denoted as
 .)
.)
Transfer function
A transfer function is a mathematical representation, in terms of spatial or temporal frequency, of the relation between the input and output of a linear time-invariant system. With optical imaging devices, for example, it is the Fourier transform of the point spread function i.e...
) between the input and output is nonlinear, then values of the coherence can be erroneous. Another common mistake is to assume a causal input/output relation between observed variables, when in fact the causative mechanism is not in the system model. For example, it is clear that the atmospheric barometric pressure induces a variation in both the ocean water levels and the groundwater levels, but the barometric pressure is not included in the system model as an input variable. We have also assumed that the ocean water levels drive or control the groundwater levels. In reality it is a combination of hydrological forcing and tidal potential that are driving both the observed input and output signals. Additionally, noise introduced in the measurement process, or by the spectral signal processing can contribute to the coherence.
Extension to non-stationary signals
If the signals are non-stationary, (and therefore not ergodicErgodic process
In signal processing, a stochastic process is said to be ergodic if its statistical properties can be deduced from a single, sufficiently long sample of the process.- Specific definitions :...
), the above formulations may not be appropriate. For such signals, the concept of coherence has been extended by using the concept of time-frequency distributions to represent the time-varying spectral variations of non-stationary signals in lieu of traditional spectra. For more details, see .