

Cladogram
Encyclopedia
A cladogram is a diagram used in cladistics
which shows ancestral relations between organisms, to represent the evolutionary tree of life
. Although traditionally such cladograms were generated largely on the basis of morphological characters, DNA
and RNA
sequencing data and computational phylogenetics
are now very commonly used in the generation of cladograms.
For example, if analyzing 20 species of birds, the data might be:
All the data are then organized into a "taxon-character matrix", which is the base to perform phylogenetic analysis.
, unicellular, etc.) or molecular (DNA, RNA, or other genetic information). Prior to the advent of DNA sequencing, all cladistic analysis used morphological data.
As DNA sequencing
has become cheaper and easier, molecular systematics has become a more and more popular way to reconstruct phylogenies. Using a parsimony criterion is only one of several methods to infer a phylogeny from molecular data; maximum likelihood
and Bayesian inference
, which incorporate explicit models of sequence evolution, are non-Hennigian ways to evaluate sequence data. Another powerful method of reconstructing phylogenies is the use of genomic retrotransposon marker
s, which are thought to be less prone to the problem of reversion that plagues sequence data. They are also generally assumed to have a low incidence of homoplasies because it was once thought that their integration into the genome
was entirely random; this seems at least sometimes not to be the case, however.
Ideally, morphological, molecular, and possibly other phylogenies should be combined into an analysis of total evidence: All have different intrinsic sources of error. For example, character convergence (homoplasy) is much more common in morphological data than in molecular sequence data, but character reversions that are unrecognizable as such are more common in the latter (see long branch attraction
). Morphological homoplasies can usually be recognized as such if character states are defined with enough attention to detail.
A well known example of homoplasy due to convergent evolution would be the character, "presence of wings". Though the wings of birds, bat
s, and insects serve the same function, each evolved independently, as can be seen by their anatomy
. If a bird, bat, and a winged insect were scored for the character, "presence of wings", a homoplasy would be introduced into the dataset, and this would confound the analysis, possibly resulting in a false evolutionary scenario.
Homoplasies can often be avoided outright in morphological datasets by defining characters more precisely and increasing their number. When analyzing "supertrees" (datasets incorporating as many taxa of a suspected clade as possible), it may become unavoidable to introduce character definitions that are imprecise, as otherwise the characters might not apply at all to a large number of taxa; to continue with the "wings" example, the presence of wings would hardly be a useful character if attempting a phylogeny of all Metazoa, as most of these don't have wings at all. Cautious choice and definition of characters thus is another important element in cladistic analyses. With a faulty outgroup or character set, no method of evaluation is likely to produce a phylogeny representing the evolutionary reality.
for more information about tree-generating computer programs.
Because the total number of possible cladograms grows factorially with the number of species, it is impractical for a computer program to evaluate every individual cladogram. A typical cladistic program begins by using heuristic
techniques to identify a small number of candidate cladograms. Many cladistic programs then continue the search with the following repetitive steps:
Computer programs that generate cladograms use algorithms that are very computationally intensive, because the cladogram problem is NP-hard
.
to measure how consistent a candidate cladogram is with the data. Most cladogram algorithms use the mathematical techniques of optimization
and minimization.
In general, cladogram generation algorithms must be implemented as computer programs, although some algorithms can be performed manually when the data sets are trivial (for example, just a few species and a couple of characteristics).
Some algorithms are useful only when the characteristic data are molecular (DNA, RNA); other algorithms are useful only when the characteristic data are morphological. Other algorithms can be used when the characteristic data includes both molecular and morphological data.
Algorithms for cladograms include least squares
, neighbor-joining
, parsimony, maximum likelihood
, and Bayesian inference
.
Biologists sometimes use the term parsimony for a specific kind of cladogram generation algorithm and sometimes as an umbrella term for all cladogram algorithms.
Algorithms that perform optimization tasks (such as building cladograms) can be sensitive to the order in which the input data (the list of species and their characteristics) is presented. Inputting the data in various orders can cause the same algorithm to produce different "best" cladograms. In these situations, the user should input the data in various orders and compare the results.
Using different algorithms on a single data set can sometimes yield different "best" cladograms, because each algorithm may have a unique definition of what is "best".
Because of the astronomical number of possible cladograms, algorithms cannot guarantee that the solution is the overall best solution. A nonoptimal cladogram will be selected if the program settles on a local minimum rather than the desired global minimum. To help solve this problem, many cladogram algorithms use a simulated annealing
approach to increase the likelihood that the selected cladogram is the optimal one.
The rescaled retention index (RC) is obtained by multiplying the CI by the RI. The homoplasy index (HI) is simply 1-CI.
Cladistics
Cladistics is a method of classifying species of organisms into groups called clades, which consist of an ancestor organism and all its descendants . For example, birds, dinosaurs, crocodiles, and all descendants of their most recent common ancestor form a clade...
which shows ancestral relations between organisms, to represent the evolutionary tree of life
Tree of life (science)
Charles Darwin proposed that phylogeny, the evolutionary relatedness among species through time, was expressible as a metaphor he termed the Tree of Life...
. Although traditionally such cladograms were generated largely on the basis of morphological characters, DNA
DNA
Deoxyribonucleic acid is a nucleic acid that contains the genetic instructions used in the development and functioning of all known living organisms . The DNA segments that carry this genetic information are called genes, but other DNA sequences have structural purposes, or are involved in...
and RNA
RNA
Ribonucleic acid , or RNA, is one of the three major macromolecules that are essential for all known forms of life....
sequencing data and computational phylogenetics
Computational phylogenetics
Computational phylogenetics is the application of computational algorithms, methods and programs to phylogenetic analyses. The goal is to assemble a phylogenetic tree representing a hypothesis about the evolutionary ancestry of a set of genes, species, or other taxa...
are now very commonly used in the generation of cladograms.
Generating a cladogram
A greatly simplified procedure for generating a cladogram is:- Gather and organize data
- Consider possible cladograms
- Select best cladogram
Step 1: gather and organize data
A cladistic analysis begins with the following data:- a list of taxa (for example, species) to be organized
- a list of characteristics to be compared
- for each taxon, the value of each of the listed characteristics or character states
For example, if analyzing 20 species of birds, the data might be:
- the list of the 20 species
- characteristics such as genome sequence, skeletal anatomy, biochemical processes, and feather coloration
- for each of the 20 species, its particular genome sequence, skeletal anatomy, biochemical processes, and feather coloration
All the data are then organized into a "taxon-character matrix", which is the base to perform phylogenetic analysis.
Molecular versus morphological data
The characteristics used to create a cladogram can be roughly categorized as either morphological (synapsid skull, warm blooded, notochordNotochord
The notochord is a flexible, rod-shaped body found in embryos of all chordates. It is composed of cells derived from the mesoderm and defines the primitive axis of the embryo. In some chordates, it persists throughout life as the main axial support of the body, while in most vertebrates it becomes...
, unicellular, etc.) or molecular (DNA, RNA, or other genetic information). Prior to the advent of DNA sequencing, all cladistic analysis used morphological data.
As DNA sequencing
DNA sequencing
DNA sequencing includes several methods and technologies that are used for determining the order of the nucleotide bases—adenine, guanine, cytosine, and thymine—in a molecule of DNA....
has become cheaper and easier, molecular systematics has become a more and more popular way to reconstruct phylogenies. Using a parsimony criterion is only one of several methods to infer a phylogeny from molecular data; maximum likelihood
Maximum likelihood
In statistics, maximum-likelihood estimation is a method of estimating the parameters of a statistical model. When applied to a data set and given a statistical model, maximum-likelihood estimation provides estimates for the model's parameters....
and Bayesian inference
Bayesian inference
In statistics, Bayesian inference is a method of statistical inference. It is often used in science and engineering to determine model parameters, make predictions about unknown variables, and to perform model selection...
, which incorporate explicit models of sequence evolution, are non-Hennigian ways to evaluate sequence data. Another powerful method of reconstructing phylogenies is the use of genomic retrotransposon marker
Retrotransposon Marker
Retrotransposon markers are retrotransposons that are used as cladistic markers.The analysis of SINEs – Short INterspersed Elements – LINEs – Long INterspersed Elements – or truncated LTRs – Long Terminal Repeats – as molecular cladistic markers represents a particularly interesting complement to...
s, which are thought to be less prone to the problem of reversion that plagues sequence data. They are also generally assumed to have a low incidence of homoplasies because it was once thought that their integration into the genome
Genome
In modern molecular biology and genetics, the genome is the entirety of an organism's hereditary information. It is encoded either in DNA or, for many types of virus, in RNA. The genome includes both the genes and the non-coding sequences of the DNA/RNA....
was entirely random; this seems at least sometimes not to be the case, however.
Ideally, morphological, molecular, and possibly other phylogenies should be combined into an analysis of total evidence: All have different intrinsic sources of error. For example, character convergence (homoplasy) is much more common in morphological data than in molecular sequence data, but character reversions that are unrecognizable as such are more common in the latter (see long branch attraction
Long branch attraction
Long branch attraction is a phenomenon in phylogenetic analyses when rapidly evolving lineages are inferred to be closely related, regardless of their true evolutionary relationships. For example, in DNA sequence-based analyses, the problem arises when sequences from two lineages evolve rapidly...
). Morphological homoplasies can usually be recognized as such if character states are defined with enough attention to detail.
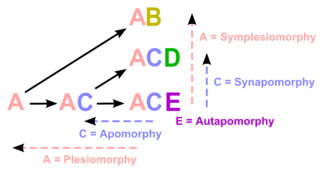
Plesiomorphies and synapomorphies
The researcher must decide which character states were present before the last common ancestor of the species group (plesiomorphies) and which were present in the last common ancestor (synapomorphies) and does so by comparison to one or more outgroups. The choice of an outgroup is a crucial step in cladistic analysis because different outgroups can produce trees with profoundly different topologies. Note that only synapomorphies are of use in characterizing clades.Avoid homoplasies
A homoplasy is a character that is shared by multiple species due to some cause other than common ancestry. The two main types of homoplasy are convergence (appearance of the same character in at least two distinct lineages) and reversion (the return to an ancestral character). Use of homoplasies when building a cladogram is sometimes unavoidable but is to be avoided when possible.A well known example of homoplasy due to convergent evolution would be the character, "presence of wings". Though the wings of birds, bat
Bat
Bats are mammals of the order Chiroptera "hand" and pteron "wing") whose forelimbs form webbed wings, making them the only mammals naturally capable of true and sustained flight. By contrast, other mammals said to fly, such as flying squirrels, gliding possums, and colugos, glide rather than fly,...
s, and insects serve the same function, each evolved independently, as can be seen by their anatomy
Anatomy
Anatomy is a branch of biology and medicine that is the consideration of the structure of living things. It is a general term that includes human anatomy, animal anatomy , and plant anatomy...
. If a bird, bat, and a winged insect were scored for the character, "presence of wings", a homoplasy would be introduced into the dataset, and this would confound the analysis, possibly resulting in a false evolutionary scenario.
Homoplasies can often be avoided outright in morphological datasets by defining characters more precisely and increasing their number. When analyzing "supertrees" (datasets incorporating as many taxa of a suspected clade as possible), it may become unavoidable to introduce character definitions that are imprecise, as otherwise the characters might not apply at all to a large number of taxa; to continue with the "wings" example, the presence of wings would hardly be a useful character if attempting a phylogeny of all Metazoa, as most of these don't have wings at all. Cautious choice and definition of characters thus is another important element in cladistic analyses. With a faulty outgroup or character set, no method of evaluation is likely to produce a phylogeny representing the evolutionary reality.
Step 2: consider possible cladograms
When there are just a few species being organized, it is possible to do this step manually, but most cases require a computer program. There are scores of computer programs available to support cladistics. See phylogenetic treePhylogenetic tree
A phylogenetic tree or evolutionary tree is a branching diagram or "tree" showing the inferred evolutionary relationships among various biological species or other entities based upon similarities and differences in their physical and/or genetic characteristics...
for more information about tree-generating computer programs.
Because the total number of possible cladograms grows factorially with the number of species, it is impractical for a computer program to evaluate every individual cladogram. A typical cladistic program begins by using heuristic
Heuristic
Heuristic refers to experience-based techniques for problem solving, learning, and discovery. Heuristic methods are used to speed up the process of finding a satisfactory solution, where an exhaustive search is impractical...
techniques to identify a small number of candidate cladograms. Many cladistic programs then continue the search with the following repetitive steps:
- Evaluate the candidate cladograms by comparing them to the characteristic data
- Identify the best candidates that are most consistent with the characteristic data
- Create additional candidates by creating several variants of each of the best candidates from the prior step
- Use heuristics to create several new candidate cladograms unrelated to the prior candidates
- Repeat these steps until the cladograms stop getting better
Computer programs that generate cladograms use algorithms that are very computationally intensive, because the cladogram problem is NP-hard
NP-hard
NP-hard , in computational complexity theory, is a class of problems that are, informally, "at least as hard as the hardest problems in NP". A problem H is NP-hard if and only if there is an NP-complete problem L that is polynomial time Turing-reducible to H...
.
Step 3: select best cladogram
There are several algorithms available to identify the "best" cladogram. Most algorithms use a metricMetric (mathematics)
In mathematics, a metric or distance function is a function which defines a distance between elements of a set. A set with a metric is called a metric space. A metric induces a topology on a set but not all topologies can be generated by a metric...
to measure how consistent a candidate cladogram is with the data. Most cladogram algorithms use the mathematical techniques of optimization
Optimization (mathematics)
In mathematics, computational science, or management science, mathematical optimization refers to the selection of a best element from some set of available alternatives....
and minimization.
In general, cladogram generation algorithms must be implemented as computer programs, although some algorithms can be performed manually when the data sets are trivial (for example, just a few species and a couple of characteristics).
Some algorithms are useful only when the characteristic data are molecular (DNA, RNA); other algorithms are useful only when the characteristic data are morphological. Other algorithms can be used when the characteristic data includes both molecular and morphological data.
Algorithms for cladograms include least squares
Least squares
The method of least squares is a standard approach to the approximate solution of overdetermined systems, i.e., sets of equations in which there are more equations than unknowns. "Least squares" means that the overall solution minimizes the sum of the squares of the errors made in solving every...
, neighbor-joining
Neighbor-joining
In bioinformatics, neighbor joining is a bottom-up clustering method for the creation of phenetic trees , created by Naruya Saitou and Masatoshi Nei...
, parsimony, maximum likelihood
Maximum likelihood
In statistics, maximum-likelihood estimation is a method of estimating the parameters of a statistical model. When applied to a data set and given a statistical model, maximum-likelihood estimation provides estimates for the model's parameters....
, and Bayesian inference
Bayesian inference
In statistics, Bayesian inference is a method of statistical inference. It is often used in science and engineering to determine model parameters, make predictions about unknown variables, and to perform model selection...
.
Biologists sometimes use the term parsimony for a specific kind of cladogram generation algorithm and sometimes as an umbrella term for all cladogram algorithms.
Algorithms that perform optimization tasks (such as building cladograms) can be sensitive to the order in which the input data (the list of species and their characteristics) is presented. Inputting the data in various orders can cause the same algorithm to produce different "best" cladograms. In these situations, the user should input the data in various orders and compare the results.
Using different algorithms on a single data set can sometimes yield different "best" cladograms, because each algorithm may have a unique definition of what is "best".
Because of the astronomical number of possible cladograms, algorithms cannot guarantee that the solution is the overall best solution. A nonoptimal cladogram will be selected if the program settles on a local minimum rather than the desired global minimum. To help solve this problem, many cladogram algorithms use a simulated annealing
Simulated annealing
Simulated annealing is a generic probabilistic metaheuristic for the global optimization problem of locating a good approximation to the global optimum of a given function in a large search space. It is often used when the search space is discrete...
approach to increase the likelihood that the selected cladogram is the optimal one.
Consistency index
The consistency index (CI) measures the amount of homoplasy in a cladogram. It is calculated by counting the mininum number of changes in a dataset and dividing it by the actual number of changes required on the cladogram.Retention index
The retention index (RI) is also a measure of the amount of homoplasy but also measures how well synapomorphies explain the tree. It is calculated taking the product of the maximum number of changes on a tree and the number of changes on the tree divided by the product of the maximum number of changes on the tree and the minimum number of changes in the dataset.The rescaled retention index (RC) is obtained by multiplying the CI by the RI. The homoplasy index (HI) is simply 1-CI.