

Central England temperature
Encyclopedia
The Central England Temperature (CET) record was originally published by Professor Gordon Manley
in 1953 and subsequently extended and updated in 1974, following many decades of painstaking work. The monthly mean
surface air temperature
s, for the Midlands
region of England
, are given (in degrees Celsius
) from the year 1659 to the present.
This record represents the longest series of monthly temperature observations in existence. It is a valuable dataset for meteorologists and climate
scientists. It is monthly from 1659, and a daily version has been produced from 1772. The monthly means from November 1722 onwards are given to a precision of 0.1°C. The earliest years of the series, from 1659 to October 1722 inclusive, for the most part only have monthly means given to the nearest degree or half a degree, though there is a small 'window' of 0.1 degree precision from 1699 to 1706 inclusive. This reflects the number, accuracy, reliability and geographical spread of the temperature records that were available for the years in question.
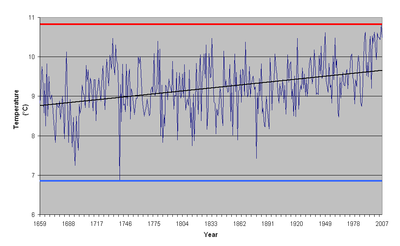 During the 18th and 19th centuries, a cool period which coincided with snowy winters and generally cool summers, the temperatures fluctuated widely but with little trend. From 1910, temperatures increased slightly until about 1950 when they flattened before a sharp rising trend began in about 1975. Temperatures in the most recent decade (years 2001-2010) were slightly higher in all seasons than the long-term average.. However, The graph shown on this page stops in 2007 and is now misleading. For a current graph see http://www.metoffice.gov.uk/hadobs/hadcet/ The more current graph shows annual anomalies relative to the 1961-1990 average and a red line which is equivalent to a 10-year running mean. This running mean has been very clearly declining since 2000.
For recent years there are two versions of the series: the "official" version maintained by the Hadley Centre
, and a version maintained by Philip Eden which he argues is more consistent with the series as originally compiled by Manley.
Records of Central England hours of sun began in 1929 (The definition of sunshine is when short wave energy of 120w/m2 minimum can be measured on the surface). Comparing this relatively short record with Central England mean temperature for the same period reveals remarkably good correlation, strongly suggesting that the temperature is directly proportional to the energy received.
HOTTEST
COLDEST
Gordon Manley
Gordon Valentine Manley, FRGS was an English climatologist who assembled the Central England temperature series of monthly mean temperatures stretching back to 1659. This is the longest standardised instrumental record available for anywhere in the world...
in 1953 and subsequently extended and updated in 1974, following many decades of painstaking work. The monthly mean
Average
In mathematics, an average, or central tendency of a data set is a measure of the "middle" value of the data set. Average is one form of central tendency. Not all central tendencies should be considered definitions of average....
surface air temperature
Temperature
Temperature is a physical property of matter that quantitatively expresses the common notions of hot and cold. Objects of low temperature are cold, while various degrees of higher temperatures are referred to as warm or hot...
s, for the Midlands
English Midlands
The Midlands, or the English Midlands, is the traditional name for the area comprising central England that broadly corresponds to the early medieval Kingdom of Mercia. It borders Southern England, Northern England, East Anglia and Wales. Its largest city is Birmingham, and it was an important...
region of England
England
England is a country that is part of the United Kingdom. It shares land borders with Scotland to the north and Wales to the west; the Irish Sea is to the north west, the Celtic Sea to the south west, with the North Sea to the east and the English Channel to the south separating it from continental...
, are given (in degrees Celsius
Celsius
Celsius is a scale and unit of measurement for temperature. It is named after the Swedish astronomer Anders Celsius , who developed a similar temperature scale two years before his death...
) from the year 1659 to the present.
This record represents the longest series of monthly temperature observations in existence. It is a valuable dataset for meteorologists and climate
Climate
Climate encompasses the statistics of temperature, humidity, atmospheric pressure, wind, rainfall, atmospheric particle count and other meteorological elemental measurements in a given region over long periods...
scientists. It is monthly from 1659, and a daily version has been produced from 1772. The monthly means from November 1722 onwards are given to a precision of 0.1°C. The earliest years of the series, from 1659 to October 1722 inclusive, for the most part only have monthly means given to the nearest degree or half a degree, though there is a small 'window' of 0.1 degree precision from 1699 to 1706 inclusive. This reflects the number, accuracy, reliability and geographical spread of the temperature records that were available for the years in question.
Data quality
Although best efforts have been made by Manley and subsequent researchers to quality control the series, there are data problems in the early years, with some non-instrumental data used. These problems account for the lower precision to which the early monthly means were quoted by Manley. Parker et al. (1992) addressed this by not using data prior to 1772, since their daily series required more accurate data than did the original seies of monthly means; MBH98 only used data from 1730 onwards. Before 1722, instrumental records do not overlap and Manley used a non-instrumental series from Utrecht compiled by Labrijn (1945), to make the monthly central England temperature (CET) series complete. Between 1723 and the 1760s most observations were taken not from outside measurements but from indoor readings in unheated rooms, and thus are of little or no use.Trends Revealed by the Series
For recent years there are two versions of the series: the "official" version maintained by the Hadley Centre
Hadley Centre for Climate Prediction and Research
The Met Office Hadley Centre for Climate Change — named in honour of George Hadley — is part of, and based at the headquarters of the Met Office in Exeter...
, and a version maintained by Philip Eden which he argues is more consistent with the series as originally compiled by Manley.
Records of Central England hours of sun began in 1929 (The definition of sunshine is when short wave energy of 120w/m2 minimum can be measured on the surface). Comparing this relatively short record with Central England mean temperature for the same period reveals remarkably good correlation, strongly suggesting that the temperature is directly proportional to the energy received.
Extrema
Taking the 353-year period for the series as a whole:HOTTEST
- The hottest year in the sequence was 2006 with a mean temperature of 10.82°C, a notable jump on the previous record, a tie between 1990 and 1999 with a mean of 10.63°C
- The warmest spring (March, April, May) was in 2011 with a mean of 10.23°C, breaking the previous record of 10.20°C set in 1893.
- The hottest summer (June, July, August) was in 1976 with a mean of 17.77°C, breaking the previous record of 17.60°C set in 1826.
- The warmest autumn (September, October, November) was in 2006 with a mean of 12.62°C, breaking the previous record of 11.80°C set in 1730.
- The mildest winter (December, January, February) was in 1869 with a mean of 6.77°C, breaking the previous record of 6.53°C set in 1834.
- The mildest January was in 1916 with a mean of 7.5°C, breaking the previous record of 7.3°C set in 1796
- The mildest February was in 1779 with a mean of 7.9°C, breaking the previous record of 6.8°C set in 1739
- The warmest March was in 1957 with a mean of 9.2°C, breaking the previous record of 9.1°C set in 1938
- The warmest April was in 2011 with a mean of 11.8C, breaking the previous record of 11.2°C set in 2007
- The warmest May was in 1833 with a mean of 15.1°C, breaking the previous record of 13.8°C set in 1758
- The hottest June was in 1846 with a mean of 18.2°C, breaking the previous record of 18.0°C set in 1676
- The hottest July was in 2006 with a mean of 19.7°C, breaking the previous record of 19.5°C set in 1983. July 2006 was also the hottest month in the series
- The hottest August was in 1995 with a mean of 19.2°C, breaking the previous record of 18.7°C set in 1975
- The warmest September was in 2006 with a mean of 16.8°C, breaking the record of 16.6°C set in 1729.
- The warmest October was in 2001 with a mean of 13.3°C, breaking the previous record of 13.0°C set in 1969
- The warmest November was in 1994 with a mean of 10.1°C, breaking the previous record of 9.5°C set in 1818
- The mildest December was in 1974 and 1934 with a mean of 8.1°C, breaking the previous record of 7.7°C set in 1852
COLDEST
- The coldest year was 1740 at a mean 6.84 °C.
- The coldest ever month was January 1795 with a mean temperature of -3.1°C.
- 60 years have passed since the last time a coldest month record was broken, the coldest February in 1947 (mean temperature -1.9°C), breaking a record set in 1895.
- The coldest winter (December, January, February) was in 1684 with a mean of -1.17°C. The devastating winter centred on January 1963 was the 3rd coldest (mean -0.33°C).
- The coolest summer was in 1725 with a mean of 13.10°C.
- Four months' (March, May, June and September) record coldest temperatures were set in the 17th century.