

Cartographic relief depiction
Encyclopedia
Terrain
Terrain, or land relief, is the vertical and horizontal dimension of land surface. When relief is described underwater, the term bathymetry is used...
or relief is an essential aspect of physical geography
Physical geography
Physical geography is one of the two major subfields of geography. Physical geography is that branch of natural science which deals with the study of processes and patterns in the natural environment like the atmosphere, biosphere and geosphere, as opposed to the cultural or built environment, the...
, and as such its portrayal presents a central problem in cartography
Cartography
Cartography is the study and practice of making maps. Combining science, aesthetics, and technique, cartography builds on the premise that reality can be modeled in ways that communicate spatial information effectively.The fundamental problems of traditional cartography are to:*Set the map's...
, and more recently GIS
Geographic Information System
A geographic information system, geographical information science, or geospatial information studies is a system designed to capture, store, manipulate, analyze, manage, and present all types of geographically referenced data...
and 3D Visualization
Visualization (graphic)
Visualization is any technique for creating images, diagrams, or animations to communicate a message. Visualization through visual imagery has been an effective way to communicate both abstract and concrete ideas since the dawn of man...
.
The most obvious way to depict relief is to imitate it at scale, as in molded or sculpted solid terrain models and molded-plastic raised-relief map
Raised-relief map
A raised-relief map or terrain model is a three-dimensional representation, usually of terrain. When representing terrain, the elevation dimension is usually exaggerated by a factor between five and ten; this facilitates the visual recognition of terrain features.-History:In his 1665 paper for the...
s. Because of the disparity between the horizontal and vertical scales of maps, raised relief is typically exaggerated.
On flat paper maps, terrain can be depicted in a variety of ways, outlined below:
Hill profiles

Hachures
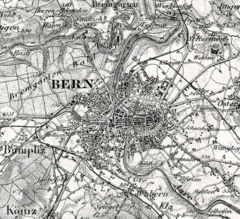
Hachures are also an older mode of representing relief. They are a form of shading, although different from the one used in shaded maps. They show the orientation of slope, and by their thickness and overall density they provide a general sense of steepness. Being non-numeric, they are less useful to a scientific survey than contours, but can successfully communicate quite specific shapes of terrain.
Hachure representation of relief was standardized by the Austrian topographer Johann Georg Lehmann in 1799.
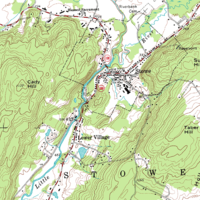
Contour lines
Contour lines (or isohypses) are isolines showing equal elevation. This is the most common way of numerically showing elevation, and is familiar from topographic mapTopographic map
A topographic map is a type of map characterized by large-scale detail and quantitative representation of relief, usually using contour lines in modern mapping, but historically using a variety of methods. Traditional definitions require a topographic map to show both natural and man-made features...
s.
Most 18th and early 19th century national surveys
Surveying
See Also: Public Land Survey SystemSurveying or land surveying is the technique, profession, and science of accurately determining the terrestrial or three-dimensional position of points and the distances and angles between them...
did not record relief across the entire area of coverage, calculating only spot elevations at survey points. The United States Geological Survey
United States Geological Survey
The United States Geological Survey is a scientific agency of the United States government. The scientists of the USGS study the landscape of the United States, its natural resources, and the natural hazards that threaten it. The organization has four major science disciplines, concerning biology,...
(USGS) topographical survey maps included contour representation of relief, and so maps that show relief, especially with exact representation of elevation, came to be called topographic maps (or "topo" maps) in the United States
United States
The United States of America is a federal constitutional republic comprising fifty states and a federal district...
, and the usage has spread internationally.
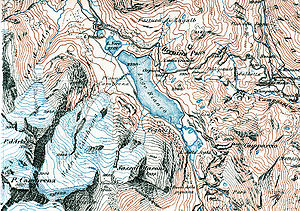
Swisstopo
Swisstopo is the official name for the Swiss Federal Office of Topography , Switzerland's national mapping agency.The current pseudo-English name was made official in 2002...
, the color of the contour lines is used to indicate the type of ground: black for bare rock and scree
Scree
Scree, also called talus, is a term given to an accumulation of broken rock fragments at the base of crags, mountain cliffs, or valley shoulders. Landforms associated with these materials are sometimes called scree slopes or talus piles...
, blue for ice and underwater contours, brown for earth-covered ground.
There are several rules to note when viewing topographic maps:
- The rule of V's: sharp-pointed vees usually are in stream valleys, with the drainage channel passing through the point of the vee, with the vee pointing upstream. This is a consequence of erosionErosionErosion is when materials are removed from the surface and changed into something else. It only works by hydraulic actions and transport of solids in the natural environment, and leads to the deposition of these materials elsewhere...
. - The rule of O's: closed loops are normally uphill on the inside and downhill on the outside, and the innermost loop is the highest area. If a loop instead represents a depression, some maps note this by short lines radiating from the inside of the loop, called "hachures".
- Spacing of contours: close contours indicate a steep slope; distant contours a shallow slope. Two or more contour lines merging indicates a cliff.
Of course, to determine differences in elevation between two points, the contour interval, or distance in altitude between two adjacent contour lines, must be known, and this is given at the bottom of the map. Usually contour intervals are consistent throughout a map, but there are exceptions. Sometimes intermediate contours are present in flatter areas; these can be dashed or dotted lines at half the noted contour interval. When contours are used with hypsometric tints on a small-scale map that includes mountains and flatter low-lying areas, it is common to have smaller intervals at lower elevations so that detail is shown in all areas. Conversely, for an island which consists of a plateau surrounded by steep cliffs, it is possible to use smaller intervals as the height increases.
Shaded relief
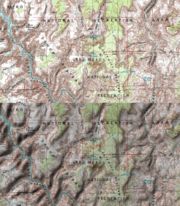
Shading
Shading refers to depicting depth perception in 3D models or illustrations by varying levels of darkness.-Drawing:Shading is a process used in drawing for depicting levels of darkness on paper by applying media more densely or with a darker shade for darker areas, and less densely or with a lighter...
thrown upon a raised relief map, or more abstractly upon the planetary surface represented. The shadows normally follow the English convention of top-left lighting
Top-left lighting
Top-left lighting is an artistic convention in which illustrations are produced so that the light appears to come from the top left of the picture....
in which the light source is placed near the upper-left corner of the map. If the map is oriented with north at the top, the result is that the light appears to come from the north-west. Many people have pointed out that this is unrealistic for maps of the northern hemisphere, because the sun does not shine from that direction, and they have proposed using southern lighting. However, the normal convention is followed to avoid multistable perception
Multistable perception
Multistable perceptual phenomena are a form of perceptual phenomena in which there are unpredictable sequences of spontaneous subjective changes...
illusions (i.e. crater/hill confusion).
Traditionally drawn with charcoal
Charcoal
Charcoal is the dark grey residue consisting of carbon, and any remaining ash, obtained by removing water and other volatile constituents from animal and vegetation substances. Charcoal is usually produced by slow pyrolysis, the heating of wood or other substances in the absence of oxygen...
, airbrush
Airbrush
An airbrush is a small, air-operated tool that sprays various media including ink and dye, but most often paint by a process of nebulization. Spray guns developed from the airbrush and are still considered a type of airbrush.-History:...
and other artist's media, shaded relief is today almost exclusively computer-generated using digital elevation model
Digital elevation model
A digital elevation model is a digital model or 3-D representation of a terrain's surface — commonly for a planet , moon, or asteroid — created from terrain elevation data....
s, with a resulting different look and feel. Much work has been done in digitally recreating the work of Swiss master Eduard Imhof
Eduard Imhof
Eduard Imhof was a professor of cartography at the Swiss Federal Institute of Technology, Zürich, from 1925 - 1965. His fame, which extends far beyond the Institute of Technology, stems from his relief shading work on school maps and atlases. Between 1922 and 1973 Imhof worked on many school maps...
, widely regarded as the master of manual hill-shading technique and theory. Imhof's contributions included a multi-color approach to shading, with purples in valleys and yellows on peaks.
The use of illumination and shadow to produce an appearance of three-dimensional space
Three-dimensional space
Three-dimensional space is a geometric 3-parameters model of the physical universe in which we live. These three dimensions are commonly called length, width, and depth , although any three directions can be chosen, provided that they do not lie in the same plane.In physics and mathematics, a...
on a flat-surfaced map
Map
A map is a visual representation of an area—a symbolic depiction highlighting relationships between elements of that space such as objects, regions, and themes....
closely parallels the painting technique known as chiaroscuro
Chiaroscuro
Chiaroscuro in art is "an Italian term which literally means 'light-dark'. In paintings the description refers to clear tonal contrasts which are often used to suggest the volume and modelling of the subjects depicted"....
.
Shaded relief today can be created digitally, using a digital elevation model
Digital elevation model
A digital elevation model is a digital model or 3-D representation of a terrain's surface — commonly for a planet , moon, or asteroid — created from terrain elevation data....
(DEM) as its basis. The DEM may be converted to shaded relief using software such as Photoshop or ArcMap
ArcMap
ArcMap is the main component of Esri's ArcGIS suite of geospatial processing programs, and is used primarily to view, edit, create, and analyze geospatial data. ArcMap allows the user to explore data within a data set, symbolize features accordingly, and create maps.- Functionality :ArcMap users...
's Spatial Analyst extension.
Physiographic illustration
Pioneered by Hungarian-American cartographer Erwin RaiszErwin Raisz
Erwin Raisz was a Hungarian-born American cartographer, best known for his physiographic maps of landforms.-Biography:...
, this technique uses generalized texture to imitate landform shapes over a large area. A combination of hill profile and shaded relief, this style of relief representation is simultaneously idiosyncratic to its creator and very useful in illustrating geomorphological patterns.
More recently, Tom Patterson
Tom Patterson (cartographer)
Tom Patterson is a cartographer working for the United States National Park Service in Harper's Ferry, West Virginia. He has developed several widely used open-source tools and bases for cartographers....
created a computer-generated map of the United States using Erwin Raisz's work as a starting point,
the Physical Map of the Coterminous United States
Forums and associations
Portrayal of relief is especially important in mountainMountain
Image:Himalaya_annotated.jpg|thumb|right|The Himalayan mountain range with Mount Everestrect 58 14 160 49 Chomo Lonzorect 200 28 335 52 Makalurect 378 24 566 45 Mount Everestrect 188 581 920 656 Tibetan Plateaurect 250 406 340 427 Rong River...
ous regions. The Commission on Mountain Cartography of the International Cartographic Association
International Cartographic Association
The International Cartographic Association , French Association Cartographique Internationale , is an organization formed of national member organizations, to provide a forum for issues and techniques in cartography...
is the best-known forum for discussion of theory and techniques for mapping these regions.
External links
- Shaded Relief, a website by Tom Patterson
- Interactive shaded relief map of the Earth by FoxDirect
- Relief Shading, a website of the Institute of Cartography at ETH ZurichETH ZurichThe Swiss Federal Institute of Technology Zurich or ETH Zürich is an engineering, science, technology, mathematics and management university in the City of Zurich, Switzerland....
- Wikipedia Graphic Lab, tutorial on creating shaded relief maps using free and open source software
- Rendering a map using relief shading technique in Photoshop