In
analytical chemistryAnalytical chemistry is the study of the separation, identification, and quantification of the chemical components of natural and artificial materials. Qualitative analysis gives an indication of the identity of the chemical species in the sample and quantitative analysis determines the amount of...
, a
calibration curve is a general method for determining the concentration of a substance in an unknown sample by comparing the unknown to a set of standard samples of known concentration. A calibration curve is one approach to the problem of instrument calibration; other approaches may mix the standard into the unknown, giving an
internal standardAn internal standard in analytical chemistry is a chemical substance that is added in a constant amount to samples, the blank and calibration standards in a chemical analysis. This substance can then be used for calibration by plotting the ratio of the analyte signal to the internal standard signal...
.
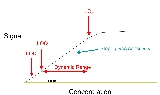
The calibration curve is a plot of how the instrumental response, the so-called
analytical signal, changes with the concentration of the
analyteAn analyte, or component , is a substance or chemical constituent that is of interest in an analytical procedure. Grammatically, it is important to note that experiments always seek to measure properties of analytes—and that analytes themselves can never be measured. For instance, one cannot...
(the substance to be measured). The operator prepares a series of standards across a range of concentrations near the expected concentration of analyte in the unknown. The concentrations of the standards must lie within the working range of the technique (instrumentation) they are using (see figure). Analyzing each of these standards using the chosen technique will produce a series of measurements. For most analyses a plot of instrument response vs. analyte concentration will show a linear relationship. The operator can measure the response of the unknown and, using the calibration curve, can
interpolate to find the concentration of analyte.
In more general use, a calibration curve is a
curveIn mathematics, the graph of a function f is the collection of all ordered pairs . In particular, if x is a real number, graph means the graphical representation of this collection, in the form of a curve on a Cartesian plane, together with Cartesian axes, etc. Graphing on a Cartesian plane is...
or
tableA table is a means of arranging data in rows and columns.Production % of goalNorth 4087102%South 4093110% The use of tables is pervasive throughout all communication, research and data analysis. Tables appear in print media, handwritten notes, computer software, architectural...
for a
measuring instrumentIn the physical sciences, quality assurance, and engineering, measurement is the activity of obtaining and comparing physical quantities of real-world objects and events. Established standard objects and events are used as units, and the process of measurement gives a number relating the item...
which measures some parameter indirectly, giving values for the desired quantity as a function of values of
sensorA sensor is a device that measures a physical quantity and converts it into a signal which can be read by an observer or by an instrument. For example, a mercury-in-glass thermometer converts the measured temperature into expansion and contraction of a liquid which can be read on a calibrated...
output. For example, a calibration curve can be made for a particular pressure transducer to determine applied
pressurePressure is the force per unit area applied in a direction perpendicular to the surface of an object. Gauge pressure is the pressure relative to the local atmospheric or ambient pressure.- Definition :...
from
transducerA transducer is a device that converts one type of energy to another. Energy types include electrical, mechanical, electromagnetic , chemical, acoustic or thermal energy. While the term transducer commonly implies the use of a sensor/detector, any device which converts energy can be considered a...
output (a voltage). Such a curve is typically used when an instrument uses a sensor whose calibration varies from one sample to another, or changes with time or use; if sensor output is consistent the instrument would be marked directly in terms of the measured unit.
The data - the concentrations of the analyte and the instrument response for each standard - can be fit to a straight line, using
linear regressionIn statistics, linear regression is an approach to modeling the relationship between a scalar variable y and one or more explanatory variables denoted X. The case of one explanatory variable is called simple regression...
analysis. This yields a model described by the equation
y = mx + y0, where
y is the instrument response,
m represents the sensitivity, and
y0 is a constant that describes the background. The analyte concentration (
x) of unknown samples may be calculated from this equation.
Many different variables can be used as the analytical signal. For instance,
chromiumChromium is a chemical element which has the symbol Cr and atomic number 24. It is the first element in Group 6. It is a steely-gray, lustrous, hard metal that takes a high polish and has a high melting point. It is also odorless, tasteless, and malleable...
(III) might be measured using a chemiluminescence method, in an instrument that contains a photomultiplier tube (PMT) as the detector. The detector converts the light produced by the sample into a voltage, which increases with intensity of light. The amount of light measured is the analytical signal.
Most analytical techniques use a calibration curve. There are a number of advantages to this approach. First, the calibration curve provides a reliable way to calculate the uncertainty of the concentration calculated from the calibration curve (using the statistics of the
least squaresThe method of least squares is a standard approach to the approximate solution of overdetermined systems, i.e., sets of equations in which there are more equations than unknowns. "Least squares" means that the overall solution minimizes the sum of the squares of the errors made in solving every...
line fit to the data).
Second, the calibration curve provides data on an empirical relationship. The mechanism for the instrument's response to the analyte may be predicted or understood according to some theoretical model, but most such models have limited value for real samples. (Instrumental response is usually highly dependent on the condition of the analyte,
solventA solvent is a liquid, solid, or gas that dissolves another solid, liquid, or gaseous solute, resulting in a solution that is soluble in a certain volume of solvent at a specified temperature...
s used and impurities it may contain; it could also be affected by external factors such as pressure and temperature.)
Many theoretical relationships, such as
fluorescenceFluorescence is the emission of light by a substance that has absorbed light or other electromagnetic radiation of a different wavelength. It is a form of luminescence. In most cases, emitted light has a longer wavelength, and therefore lower energy, than the absorbed radiation...
, require the determination of an instrumental constant anyway, by analysis of one or more reference standards; a calibration curve is a convenient extension of this approach. The calibration curve for a particular analyte in a particular (type of) sample provides the empirical relationship needed for those particular measurements.
The chief disadvantages are (1) that the standards require a supply of the analyte material, preferably of high purity and in known concentration, and (2) that the standards and the unknown are in the same matrix. Some analytes - e.g., particular proteins - are extremely difficult to obtain pure in sufficient quantity. Other analytes are often in complex matrices, e.g., heavy metals in pond water. In this case, the matrix may interfere with or attenuate the signal of the analyte. Therefore a comparison between the standards (which contain no interfering compounds) and the unknown is not possible. The method of
standard additionThe method of standard addition is used in instrumental analysis to determine concentration of a substance in an unknown sample by comparison to a set of samples of known concentration, similar to using a calibration curve...
is a way to handle such a situation.
Error in calibration curve results
As expected, the concentration of the unknown will have some error which can be calculated from the formula below. This formula assumes that a linear relationship is observed for all the standards. It is important to note that the error in the concentration will be minimal if the signal from the unknown lies in the middle of the signals of all the standards (the term

goes to zero if

)
is the standard deviation in the residuals 
is the slope of the line
is the y-intercept of the line
is the number standards
is the number of replicate unknowns
is the measurement of the unknown
is the average measurement of the standards
are the concentrations of the standards
is the average concentration of the standards
Applications
- Analysis of concentration
- Verifying the proper functioning of an analytical instrument or a sensor device such as an ion selective electrode
An ion-selective electrode , also known as a specific ion electrode , is a transducer that converts the activity of a specific ion dissolved in a solution into an electrical potential, which can be measured by a voltmeter or pH meter. The voltage is theoretically dependent on the logarithm of the...
- Determining the basic effects of a control treatment (such as a dose-survival curve in clonogenic assay
A clonogenic assay is a microbiology technique for studying the effectiveness of specific agents on the survival and proliferation of cells. It is frequently used in cancer research laboratories to determine the effect of drugs or radiation on proliferating tumor cells as well as for titration of...
)