

Breakeven
Encyclopedia
In economics
& business
, specifically cost accounting
, the break-even point (BEP) is the point at which cost or expenses and revenue are equal: there is no net loss or gain, and one has "broken even". A profit or a loss has not been made, although opportunity cost
s have been paid, and capital has received the risk-adjusted, expected return.
For example, if a business sells fewer than 200 tables each month, it will make a loss, if it sells more, it will be a profit. With this information, the business managers will then need to see if they expect to be able to make and sell 200 tables per month.
If they think they cannot sell that many, to ensure viability they could:
Any of these would reduce the break even point. In other words, the business would not need to sell so many tables to make sure it could pay its fixed costs.
model, the break-even point (in terms of Unit Sales (X)) can be directly computed in terms of Total Revenue (TR) and Total Costs (TC) as:
where:
The quantity is of interest in its own right, and is called the Unit Contribution Margin
(C): it is the marginal profit per unit, or alternatively the portion of each sale that contributes to Fixed Costs. Thus the break-even point can be more simply computed as the point where Total Contribution = Total Fixed Cost:
In currency units (sales proceeds) to reach break-even, one can use the above calculation and multiply by Price, or equivalently use the Contribution Margin Ratio (Unit Contribution Margin over Price) to compute it as:

R=C,
Where R is revenue generated,
C is cost incurred i.e.
Fixed costs + Variable Costs
or
Q * P(Price per unit) = TFC + Q * VC(Price per unit),
Q * P - Q * VC = TFC,
Q * (P - VC) = TFC,
or,
Break Even Analysis
Q = TFC/c/s ratio=Break Even
®®
margin of safety = (current output - breakeven output)
margin of safety% = (current output - breakeven output)/current output x 100
When dealing with budgets you would instead replace "Current output" with "Budgeted output".
If P/V ratio is given then
profit/ PV ratio
In unit
Break Even Analysis
By inserting different prices into the formula, you will obtain a number of break even points, one for each possible price charged. If the firm changes the selling price for its product, from $2 to $2.30, in the example above, then it would have to sell only (1000/(2.3 - 0.6))= 589 units to break even, rather than 715.
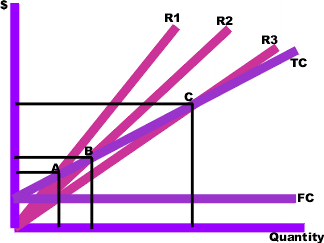
To make the results clearer, they can be graphed. To do this, you draw the total cost curve (TC in the diagram) which shows the total cost associated with each possible level of output, the fixed cost curve (FC) which shows the costs that do not vary with output level, and finally the various total revenue lines (R1, R2, and R3) which show the total amount of revenue received at each output level, given the price you will be
charging.
The break even points (A,B,C) are the points of intersection between the total cost curve (TC) and a total revenue curve (R1, R2, or R3). The break even quantity at each selling price can be read off the horizontal axis and the break even price at each selling price can be read off the vertical axis. The total cost, total revenue, and fixed cost curves can each be constructed with simple formulae. For example, the total revenue curve is simply the product of selling price times quantity for each output quantity. The data used in these formulae come either from accounting records or from various estimation techniques such as regression analysis
.
The break-even point is a special case of Target Income Sales, where Target Income is 0 (breaking even). This is very important for financial analysis.
Limitations
External links
Further reading
Economics
Economics is the social science that analyzes the production, distribution, and consumption of goods and services. The term economics comes from the Ancient Greek from + , hence "rules of the house"...
& business
Business
A business is an organization engaged in the trade of goods, services, or both to consumers. Businesses are predominant in capitalist economies, where most of them are privately owned and administered to earn profit to increase the wealth of their owners. Businesses may also be not-for-profit...
, specifically cost accounting
Cost accounting
Cost accounting information is designed for managers. Since managers are taking decisions only for their own organization, there is no need for the information to be comparable to similar information from other organizations...
, the break-even point (BEP) is the point at which cost or expenses and revenue are equal: there is no net loss or gain, and one has "broken even". A profit or a loss has not been made, although opportunity cost
Opportunity cost
Opportunity cost is the cost of any activity measured in terms of the value of the best alternative that is not chosen . It is the sacrifice related to the second best choice available to someone, or group, who has picked among several mutually exclusive choices. The opportunity cost is also the...
s have been paid, and capital has received the risk-adjusted, expected return.
For example, if a business sells fewer than 200 tables each month, it will make a loss, if it sells more, it will be a profit. With this information, the business managers will then need to see if they expect to be able to make and sell 200 tables per month.
If they think they cannot sell that many, to ensure viability they could:
- Try to reduce the fixed costs (by renegotiating rent for example, or keeping better control of telephone bills or other costs)
- Try to reduce variable costs (the price it pays for the tables by finding a new supplier)
- Increase the selling price of their tables.
Any of these would reduce the break even point. In other words, the business would not need to sell so many tables to make sure it could pay its fixed costs.
Computation
In the linear Cost-Volume-Profit AnalysisCost-Volume-Profit Analysis
Coon-Volume-profit , in managerial economics is a form of cost accounting. It is a simplified model, useful for elementary instruction and for short-run decisions....
model, the break-even point (in terms of Unit Sales (X)) can be directly computed in terms of Total Revenue (TR) and Total Costs (TC) as:
where:
- TFC is Total Fixed Costs,
- P is Unit Sale Price, and
- V is Unit Variable Cost.
The quantity
is of interest in its own right, and is called the Unit Contribution MarginContribution margin
In cost-volume-profit analysis, a form of management accounting, contribution margin is the marginal profit per unit sale. It is a useful quantity in carrying out various calculations, and can be used as a measure of operating leverage...
(C): it is the marginal profit per unit, or alternatively the portion of each sale that contributes to Fixed Costs. Thus the break-even point can be more simply computed as the point where Total Contribution = Total Fixed Cost:
In currency units (sales proceeds) to reach break-even, one can use the above calculation and multiply by Price, or equivalently use the Contribution Margin Ratio (Unit Contribution Margin over Price) to compute it as:
R=C,
Where R is revenue generated,
C is cost incurred i.e.
Fixed costs + Variable Costs
or
Q * P(Price per unit) = TFC + Q * VC(Price per unit),
Q * P - Q * VC = TFC,
Q * (P - VC) = TFC,
or,
Break Even Analysis
Q = TFC/c/s ratio=Break Even
®®
Margin of Safety
Margin of safety represents the strength of the business. It enables a business to know what is the exact amount it has gained or lost and whether they are over or below the break even point.margin of safety = (current output - breakeven output)
margin of safety% = (current output - breakeven output)/current output x 100
When dealing with budgets you would instead replace "Current output" with "Budgeted output".
If P/V ratio is given then
profit/ PV ratio
In unit
Break Even = 
where FC is Fixed Cost, SP is Selling Price and VC is Variable Cost
Break Even AnalysisBy inserting different prices into the formula, you will obtain a number of break even points, one for each possible price charged. If the firm changes the selling price for its product, from $2 to $2.30, in the example above, then it would have to sell only (1000/(2.3 - 0.6))= 589 units to break even, rather than 715.
To make the results clearer, they can be graphed. To do this, you draw the total cost curve (TC in the diagram) which shows the total cost associated with each possible level of output, the fixed cost curve (FC) which shows the costs that do not vary with output level, and finally the various total revenue lines (R1, R2, and R3) which show the total amount of revenue received at each output level, given the price you will be
charging.
The break even points (A,B,C) are the points of intersection between the total cost curve (TC) and a total revenue curve (R1, R2, or R3). The break even quantity at each selling price can be read off the horizontal axis and the break even price at each selling price can be read off the vertical axis. The total cost, total revenue, and fixed cost curves can each be constructed with simple formulae. For example, the total revenue curve is simply the product of selling price times quantity for each output quantity. The data used in these formulae come either from accounting records or from various estimation techniques such as regression analysis
Regression analysis
In statistics, regression analysis includes many techniques for modeling and analyzing several variables, when the focus is on the relationship between a dependent variable and one or more independent variables...
.
Application
The break-even point is one of the simplest yet least used analytical tools in management. It helps to provide a dynamic view of the relationships between sales, costs and profits. A better understanding of break-even, for example, is expressing break-even sales as a percentage of actual sales—can give managers a chance to understand when to expect to break even (by linking the percent to when in the week/month this percent of sales might occur).The break-even point is a special case of Target Income Sales, where Target Income is 0 (breaking even). This is very important for financial analysis.
Limitations
- Break-even analysis is only a supply side (i.e. costs only) analysis, as it tells you nothing about what sales are actually likely to be for the product at these various prices.
- It assumes that fixed costs (FC) are constant. Although, this is true in the short run, an increase in the scale of production is likely to cause fixed costs to rise.
- It assumes average variable costs are constant per unit of output, at least in the range of likely quantities of sales. (i.e. linearity)
- It assumes that the quantity of goods produced is equal to the quantity of goods sold (i.e., there is no change in the quantity of goods held in inventory at the beginning of the period and the quantity of goods held in inventory at the end of the period).
- In multi-product companies, it assumes that the relative proportions of each product sold and produced are constant (i.e., the sales mix is constant).
External links
- Example of Break Even Point using Microsoft Excel
- Videos and Tutorials about Break Even Analysis
- Break Even, any profitability ratio search in what-if? model with MS Excel
Further reading
- D Dayananda – R Irons – S Harrison - J Herbohn - P Rowland, 2002, Capital Budgeting: Financial appraisal of investment projects – Cambridge University Press. pp. 150