

Bivariate analysis
Encyclopedia
Bivariate analysis is one of the simplest forms of the quantitative (statistical) analysis
. It involves the analysis of two variable
s (often denoted as X, Y), for the purpose of determining the empirical relationship between them. In order to see if the variables are related to one another, it is common to measure how those two variables simultaneously change together (see also covariance
).
Bivariate analysis can be helpful in testing simple hypotheses of association
and causality
– checking to what extent it becomes easier to know and predict a value for the dependent variable if we know a case's value on the independent variable
(see also correlation
).
Bivariate analysis can be contrasted with univariate analysis
in which only one variable is analysed. Furthermore, the purpose of a univariate analysis is descriptive. Subgroup comparison – the descriptive analysis of two variables – can be sometimes seen as a very simple form of bivariate analysis (or as univariate analysis extended to two variables). The major differentiating point between univariate and bivariate analysis, in addition to looking at more than one variable, is that the purpose of a bivariate analysis goes beyond simply descriptive: it is the analysis of the relationship between the two variables.
table, a scatterplot
graph, or the computation of a simple correlation coefficient
. For example, a bivariate analysis intended to investigate whether there is any significant difference in earnings of men and women might involve creating a table of percentages of the population within various categories, using categories based on gender and earnings:
The types of analysis that are suited to particular pairs of variables vary in accordance with the level of measurement
of the variables of interest (e.g., nominal/categorical, ordinal, interval/ratio).
Bivariate analysis is a simple (two variable) variant of multivariate analysis
(where multiple relations between multiple variables are examined simultaneously).
Step 2: Identify the type and direction, if applicable, of the relationship.
Step 3: Determine if the relationship is statistically significant and generalizable to the population.
Step 4: Identify the strength of the relationship, i.e. the degree to which the values of the independent variable explain the variation in the dependent variable.
Statistics
Statistics is the study of the collection, organization, analysis, and interpretation of data. It deals with all aspects of this, including the planning of data collection in terms of the design of surveys and experiments....
. It involves the analysis of two variable
Variable
Variable may refer to:* Variable , a logical set of attributes* Variable , a symbol that represents a quantity in an algebraic expression....
s (often denoted as X, Y), for the purpose of determining the empirical relationship between them. In order to see if the variables are related to one another, it is common to measure how those two variables simultaneously change together (see also covariance
Covariance
In probability theory and statistics, covariance is a measure of how much two variables change together. Variance is a special case of the covariance when the two variables are identical.- Definition :...
).
Bivariate analysis can be helpful in testing simple hypotheses of association
Association (statistics)
In statistics, an association is any relationship between two measured quantities that renders them statistically dependent. The term "association" refers broadly to any such relationship, whereas the narrower term "correlation" refers to a linear relationship between two quantities.There are many...
and causality
Causality
Causality is the relationship between an event and a second event , where the second event is understood as a consequence of the first....
– checking to what extent it becomes easier to know and predict a value for the dependent variable if we know a case's value on the independent variable
Independent variable
The terms "dependent variable" and "independent variable" are used in similar but subtly different ways in mathematics and statistics as part of the standard terminology in those subjects...
(see also correlation
Correlation
In statistics, dependence refers to any statistical relationship between two random variables or two sets of data. Correlation refers to any of a broad class of statistical relationships involving dependence....
).
Bivariate analysis can be contrasted with univariate analysis
Univariate analysis
Univariate analysis is the simplest form of quantitative analysis. The analysis is carried out with the description of a single variable and its attributes of the applicable unit of analysis...
in which only one variable is analysed. Furthermore, the purpose of a univariate analysis is descriptive. Subgroup comparison – the descriptive analysis of two variables – can be sometimes seen as a very simple form of bivariate analysis (or as univariate analysis extended to two variables). The major differentiating point between univariate and bivariate analysis, in addition to looking at more than one variable, is that the purpose of a bivariate analysis goes beyond simply descriptive: it is the analysis of the relationship between the two variables.
Types of analysis
Common forms of bivariate analysis involve creating a percentagePercentage
In mathematics, a percentage is a way of expressing a number as a fraction of 100 . It is often denoted using the percent sign, “%”, or the abbreviation “pct”. For example, 45% is equal to 45/100, or 0.45.Percentages are used to express how large/small one quantity is, relative to another quantity...
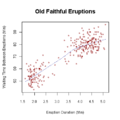
table, a scatterplot
Scatterplot
A scatter plot or scattergraph is a type of mathematical diagram using Cartesian coordinates to display values for two variables for a set of data....
graph, or the computation of a simple correlation coefficient
Pearson product-moment correlation coefficient
In statistics, the Pearson product-moment correlation coefficient is a measure of the correlation between two variables X and Y, giving a value between +1 and −1 inclusive...
. For example, a bivariate analysis intended to investigate whether there is any significant difference in earnings of men and women might involve creating a table of percentages of the population within various categories, using categories based on gender and earnings:
| Earnings | Men | Women |
|---|---|---|
| under 20,000$ | 47% | 52% |
| 20,000–50,000$ | 45% | 47% |
| over 50,000$ | 8% | 1% |
| Valid cases: 200 Missing cases: 0 |
||
The types of analysis that are suited to particular pairs of variables vary in accordance with the level of measurement
Level of measurement
The "levels of measurement", or scales of measure are expressions that typically refer to the theory of scale types developed by the psychologist Stanley Smith Stevens. Stevens proposed his theory in a 1946 Science article titled "On the theory of scales of measurement"...
of the variables of interest (e.g., nominal/categorical, ordinal, interval/ratio).
Bivariate analysis is a simple (two variable) variant of multivariate analysis
Multivariate analysis
Multivariate analysis is based on the statistical principle of multivariate statistics, which involves observation and analysis of more than one statistical variable at a time...
(where multiple relations between multiple variables are examined simultaneously).
Steps in Conducting Bivariate Analysis
Step 1: Define the nature of the relationship whether the values of the independent variables relate to the values of the dependent variable or not.Step 2: Identify the type and direction, if applicable, of the relationship.
Step 3: Determine if the relationship is statistically significant and generalizable to the population.
Step 4: Identify the strength of the relationship, i.e. the degree to which the values of the independent variable explain the variation in the dependent variable.