
Bifurcation diagram
Encyclopedia
In mathematics
, particularly in dynamical systems, a bifurcation diagram shows the possible long-term values (equilibria/fixed points or periodic orbits) of a system as a function of a bifurcation parameter
in the system. It is usual to represent stable solutions with a solid line and unstable solutions with a dotted line.
 An example is the bifurcation diagram of the logistic map
:

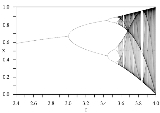
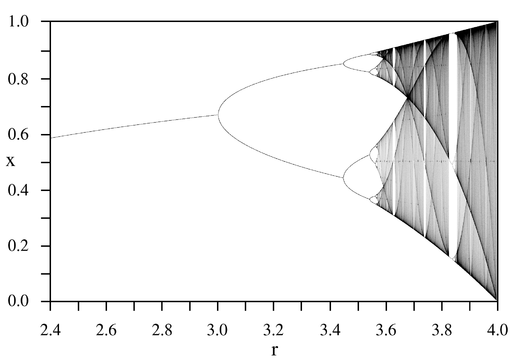
The bifurcation parameter r is shown on the horizontal axis of the plot and the vertical axis shows the possible long-term population values of the logistic function. Only the stable solutions are shown here, there are many other unstable solutions which are not shown in this diagram.
The bifurcation diagram nicely shows the forking of the possible periods of stable orbits from 1 to 2 to 4 to 8 etc. Each of these bifurcation points is a period-doubling bifurcation
.
The ratio of the lengths of successive intervals between values of r for which bifurcation occurs converges to the first Feigenbaum constant.
 .
.
 In a dynamical system such as
 ,
,
which is structurally stable when , if a bifurcation diagram is plotted, treating
  as the bifurcation parameter, but for different values of
  , the case
  is the symmetric pitchfork bifurcation. When
  , we say we have a pitchfork with broken symmetry. This is illustrated in the animation on the right.
Mathematics
Mathematics is the study of quantity, space, structure, and change. Mathematicians seek out patterns and formulate new conjectures. Mathematicians resolve the truth or falsity of conjectures by mathematical proofs, which are arguments sufficient to convince other mathematicians of their validity...
, particularly in dynamical systems, a bifurcation diagram shows the possible long-term values (equilibria/fixed points or periodic orbits) of a system as a function of a bifurcation parameter
Bifurcation theory
Bifurcation theory is the mathematical study of changes in the qualitative or topological structure of a given family, such as the integral curves of a family of vector fields, and the solutions of a family of differential equations...
in the system. It is usual to represent stable solutions with a solid line and unstable solutions with a dotted line.
Logistic map
Logistic map
The logistic map is a polynomial mapping of degree 2, often cited as an archetypal example of how complex, chaotic behaviour can arise from very simple non-linear dynamical equations...
:
The bifurcation parameter r is shown on the horizontal axis of the plot and the vertical axis shows the possible long-term population values of the logistic function. Only the stable solutions are shown here, there are many other unstable solutions which are not shown in this diagram.
The bifurcation diagram nicely shows the forking of the possible periods of stable orbits from 1 to 2 to 4 to 8 etc. Each of these bifurcation points is a period-doubling bifurcation
Period-doubling bifurcation
In mathematics, a period doubling bifurcation in a discrete dynamical system is a bifurcation in which the system switches to a new behavior with twice the period of the original system...
.
The ratio of the lengths of successive intervals between values of r for which bifurcation occurs converges to the first Feigenbaum constant.
Real quadratic map
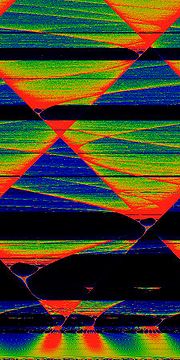
The map is.Symmetry breaking in bifurcation sets
,which is structurally stable when
, if a bifurcation diagram is plotted, treating as the bifurcation parameter, but for different values of , the case is the symmetric pitchfork bifurcation. When , we say we have a pitchfork with broken symmetry. This is illustrated in the animation on the right.See also
- Bifurcation theoryBifurcation theoryBifurcation theory is the mathematical study of changes in the qualitative or topological structure of a given family, such as the integral curves of a family of vector fields, and the solutions of a family of differential equations...
- Feigenbaum constantsFeigenbaum constantsThe Feigenbaum constants are two mathematical constants named after the mathematician Mitchell Feigenbaum. Both express ratios in a bifurcation diagram.The first Feigenbaum constant ,...
- Phase portraitPhase portraitA phase portrait is a geometric representation of the trajectories of a dynamical system in the phase plane. Each set of initial conditions is representated by a different curve, or point....
- Skeleton of bifurcation diagram
External links
- Logistic Map Simulation. A Java applet simulating the Logistic Map by Yuval Baror.
- The Logistic Map and Chaos