

Autocorrelation
Encyclopedia
Cross-correlation
In signal processing, cross-correlation is a measure of similarity of two waveforms as a function of a time-lag applied to one of them. This is also known as a sliding dot product or sliding inner-product. It is commonly used for searching a long-duration signal for a shorter, known feature...
of a signal with itself. Informally, it is the similarity between observations as a function of the time separation between them. It is a mathematical tool for finding repeating patterns, such as the presence of a periodic signal which has been buried under noise, or identifying the missing fundamental
Missing fundamental
A sound is said to have a missing fundamental, suppressed fundamental, or phantom fundamental when its overtones suggest a fundamental frequency but the sound lacks a component at the fundamental frequency itself....
frequency in a signal implied by its harmonic
Harmonic
A harmonic of a wave is a component frequency of the signal that is an integer multiple of the fundamental frequency, i.e. if the fundamental frequency is f, the harmonics have frequencies 2f, 3f, 4f, . . . etc. The harmonics have the property that they are all periodic at the fundamental...
frequencies. It is often used in signal processing
Signal processing
Signal processing is an area of systems engineering, electrical engineering and applied mathematics that deals with operations on or analysis of signals, in either discrete or continuous time...
for analyzing functions or series of values, such as time domain
Time domain
Time domain is a term used to describe the analysis of mathematical functions, physical signals or time series of economic or environmental data, with respect to time. In the time domain, the signal or function's value is known for all real numbers, for the case of continuous time, or at various...
signals.
Definitions
Different fields of study define autocorrelation differently, and not all of these definitions are equivalent. In some fields, the term is used interchangeably with autocovarianceAutocovariance
In statistics, given a real stochastic process X, the autocovariance is the covariance of the variable with itself, i.e. the variance of the variable against a time-shifted version of itself...
.
Statistics
In statisticsStatistics
Statistics is the study of the collection, organization, analysis, and interpretation of data. It deals with all aspects of this, including the planning of data collection in terms of the design of surveys and experiments....
, the autocorrelation of a random process describes the correlation
Correlation
In statistics, dependence refers to any statistical relationship between two random variables or two sets of data. Correlation refers to any of a broad class of statistical relationships involving dependence....
between values of the process at different points in time, as a function of the two times or of the time difference. Let X be some repeatable process, and i be some point in time after the start of that process. (i may be an integer
Integer
The integers are formed by the natural numbers together with the negatives of the non-zero natural numbers .They are known as Positive and Negative Integers respectively...
for a discrete-time process or a real number
Real number
In mathematics, a real number is a value that represents a quantity along a continuum, such as -5 , 4/3 , 8.6 , √2 and π...
for a continuous-time process.) Then Xi is the value (or realization
Realization (probability)
In probability and statistics, a realization, or observed value, of a random variable is the value that is actually observed . The random variable itself should be thought of as the process how the observation comes about...
) produced by a given run of the process at time i. Suppose that the process is further known to have defined values for mean
Mean
In statistics, mean has two related meanings:* the arithmetic mean .* the expected value of a random variable, which is also called the population mean....
μi and variance
Variance
In probability theory and statistics, the variance is a measure of how far a set of numbers is spread out. It is one of several descriptors of a probability distribution, describing how far the numbers lie from the mean . In particular, the variance is one of the moments of a distribution...
σi2 for all times i. Then the definition of the autocorrelation between times s and t is
where "E" is the expected value
Expected value
In probability theory, the expected value of a random variable is the weighted average of all possible values that this random variable can take on...
operator. Note that this expression is not well-defined for all time series or processes, because the variance may be zero (for a constant process) or infinite. If the function R is well-defined, its value must lie in the range [−1, 1], with 1 indicating perfect correlation and −1 indicating perfect anti-correlation
Negative relationship
In statistics, a relationship between two variables is negative if the slope in a corresponding graph is negative, or—what is in some contexts equivalent—if the correlation between them is negative...
.
If Xt is a second-order stationary process then the mean μ and the variance σ2 are time-independent, and further the autocorrelation depends only on the difference between t and s: the correlation depends only on the time-distance between the pair of values but not on their position in time. This further implies that the autocorrelation can be expressed as a function of the time-lag, and that this would be an even function
Even and odd functions
In mathematics, even functions and odd functions are functions which satisfy particular symmetry relations, with respect to taking additive inverses. They are important in many areas of mathematical analysis, especially the theory of power series and Fourier series...
of the lag τ = s − t. This gives the more familiar form
and the fact that this is an even function can be stated as

It is common practice in some disciplines, other than statistics and time series analysis, to drop the normalization by σ2 and use the term "autocorrelation" interchangeably with "autocovariance". However, the normalization is important both because the interpretation of the autocorrelation as a correlation provides a scale-free measure of the strength of statistical dependence, and because the normalization has an effect on the statistical properties of the estimated autocorrelations.
Signal processing
In signal processingSignal processing
Signal processing is an area of systems engineering, electrical engineering and applied mathematics that deals with operations on or analysis of signals, in either discrete or continuous time...
, the above definition is often used without the normalization, that is, without subtracting the mean and dividing by the variance. When the autocorrelation function is normalized by mean and variance, it is sometimes referred to as the autocorrelation coefficient.
Given a signal
 , the continuous autocorrelation
  is most often defined as the continuous cross-correlation integral of
  with itself, at lag
  .
.
where
 represents the complex conjugate
Complex conjugate
In mathematics, complex conjugates are a pair of complex numbers, both having the same real part, but with imaginary parts of equal magnitude and opposite signs...
and
 represents convolution
Convolution
In mathematics and, in particular, functional analysis, convolution is a mathematical operation on two functions f and g, producing a third function that is typically viewed as a modified version of one of the original functions. Convolution is similar to cross-correlation...
. For a real function,
 .
.The discrete autocorrelation
 at lag
  for a discrete signal
  is
is
The above definitions work for signals that are square integrable, or square summable, that is, of finite energy. Signals that "last forever" are treated instead as random processes, in which case different definitions are needed, based on expected values. For wide-sense-stationary random processes
Stationary process
In the mathematical sciences, a stationary process is a stochastic process whose joint probability distribution does not change when shifted in time or space...
, the autocorrelations are defined as
For processes that are not stationary
Stationary process
In the mathematical sciences, a stationary process is a stochastic process whose joint probability distribution does not change when shifted in time or space...
, these will also be functions of
 , or
, or  .
.For processes that are also ergodic
Ergodic process
In signal processing, a stochastic process is said to be ergodic if its statistical properties can be deduced from a single, sufficiently long sample of the process.- Specific definitions :...
, the expectation can be replaced by the limit of a time average. The autocorrelation of an ergodic process is sometimes defined as or equated to
These definitions have the advantage that they give sensible well-defined single-parameter results for periodic functions, even when those functions are not the output of stationary ergodic processes.
Alternatively, signals that last forever can be treated by a short-time autocorrelation function analysis, using finite time integrals. (See short-time Fourier transform
Short-time Fourier transform
The short-time Fourier transform , or alternatively short-term Fourier transform, is a Fourier-related transform used to determine the sinusoidal frequency and phase content of local sections of a signal as it changes over time....
for a related process.)
Multi-dimension
Dimension
In physics and mathematics, the dimension of a space or object is informally defined as the minimum number of coordinates needed to specify any point within it. Thus a line has a dimension of one because only one coordinate is needed to specify a point on it...
al autocorrelation is defined similarly. For example, in three dimensions
Three-dimensional space
Three-dimensional space is a geometric 3-parameters model of the physical universe in which we live. These three dimensions are commonly called length, width, and depth , although any three directions can be chosen, provided that they do not lie in the same plane.In physics and mathematics, a...
the autocorrelation of a square-summable discrete signal
Discrete signal
A discrete signal or discrete-time signal is a time series consisting of a sequence of qualities...
would be

When mean values are subtracted from signals before computing an autocorrelation function, the resulting function is usually called an auto-covariance function.
Properties
In the following, we will describe properties of one-dimensional autocorrelations only, since most properties are easily transferred from the one-dimensional case to the multi-dimensional cases.- A fundamental property of the autocorrelation is symmetry,
 , which is easy to prove from the definition. In the continuous case,
- the autocorrelation is an even function
-
 when
when  is a real function,
- and the autocorrelation is a Hermitian function
-
 when
when  is a complex function.
- The continuous autocorrelation function reaches its peak at the origin, where it takes a real value, i.e. for any delay
 ,
,  . This is a consequence of the Cauchy–Schwarz inequalityCauchy–Schwarz inequalityIn mathematics, the Cauchy–Schwarz inequality , is a useful inequality encountered in many different settings, such as linear algebra, analysis, probability theory, and other areas...
. The same result holds in the discrete case.
- The autocorrelation of a periodic functionPeriodic functionIn mathematics, a periodic function is a function that repeats its values in regular intervals or periods. The most important examples are the trigonometric functions, which repeat over intervals of length 2π radians. Periodic functions are used throughout science to describe oscillations,...
is, itself, periodic with the same period.
- The autocorrelation of the sum of two completely uncorrelated functions (the cross-correlation is zero for all
 ) is the sum of the autocorrelations of each function separately.
- Since autocorrelation is a specific type of cross-correlationCross-correlationIn signal processing, cross-correlation is a measure of similarity of two waveforms as a function of a time-lag applied to one of them. This is also known as a sliding dot product or sliding inner-product. It is commonly used for searching a long-duration signal for a shorter, known feature...
, it maintains all the properties of cross-correlation.
- The autocorrelation of a continuous-time white noiseWhite noiseWhite noise is a random signal with a flat power spectral density. In other words, the signal contains equal power within a fixed bandwidth at any center frequency...
signal will have a strong peak (represented by a Dirac delta functionDirac delta functionThe Dirac delta function, or δ function, is a generalized function depending on a real parameter such that it is zero for all values of the parameter except when the parameter is zero, and its integral over the parameter from −∞ to ∞ is equal to one. It was introduced by theoretical...
) at and will be absolutely 0 for all other
  .
.
- The Wiener–Khinchin theoremWiener–Khinchin theoremThe Wiener–Khinchin theorem states that the power spectral density of a wide–sense stationary random process is the Fourier transform of the corresponding autocorrelation function.-History:Norbert Wiener first published the result in...
relates the autocorrelation function to the power spectral densitySpectral densityIn statistical signal processing and physics, the spectral density, power spectral density , or energy spectral density , is a positive real function of a frequency variable associated with a stationary stochastic process, or a deterministic function of time, which has dimensions of power per hertz...
via the Fourier transformFourier transformIn mathematics, Fourier analysis is a subject area which grew from the study of Fourier series. The subject began with the study of the way general functions may be represented by sums of simpler trigonometric functions...
:
- For real-valued functions, the symmetric autocorrelation function has a real symmetric transform, so the Wiener–Khinchin theoremWiener–Khinchin theoremThe Wiener–Khinchin theorem states that the power spectral density of a wide–sense stationary random process is the Fourier transform of the corresponding autocorrelation function.-History:Norbert Wiener first published the result in...
can be re-expressed in terms of real cosines only:
Efficient computation
For data expressed as a discreteDiscrete
Discrete in science is the opposite of continuous: something that is separate; distinct; individual.Discrete may refer to:*Discrete particle or quantum in physics, for example in quantum theory...
sequence, it is frequently necessary to compute the autocorrelation with high computational efficiency
Algorithmic efficiency
In computer science, efficiency is used to describe properties of an algorithm relating to how much of various types of resources it consumes. Algorithmic efficiency can be thought of as analogous to engineering productivity for a repeating or continuous process, where the goal is to reduce...
. While the brute force algorithm is order
Big O notation
In mathematics, big O notation is used to describe the limiting behavior of a function when the argument tends towards a particular value or infinity, usually in terms of simpler functions. It is a member of a larger family of notations that is called Landau notation, Bachmann-Landau notation, or...
 , several efficient algorithms exist which can compute the autocorrelation in order
  . For example, the Wiener–Khinchin theorem
Wiener–Khinchin theorem
The Wiener–Khinchin theorem states that the power spectral density of a wide–sense stationary random process is the Fourier transform of the corresponding autocorrelation function.-History:Norbert Wiener first published the result in...
allows computing the autocorrelation from the raw data
 with two Fast Fourier transform
Fast Fourier transform
A fast Fourier transform is an efficient algorithm to compute the discrete Fourier transform and its inverse. "The FFT has been called the most important numerical algorithm of our lifetime ." There are many distinct FFT algorithms involving a wide range of mathematics, from simple...
s (FFT):
where IFFT denotes the inverse Fast Fourier transform
Fast Fourier transform
A fast Fourier transform is an efficient algorithm to compute the discrete Fourier transform and its inverse. "The FFT has been called the most important numerical algorithm of our lifetime ." There are many distinct FFT algorithms involving a wide range of mathematics, from simple...
. The asterisk denotes complex conjugate.
Alternatively, a multiple
 correlation can be performed by using brute force calculation for low
  values, and then progressively binning the
  data with a logarithm
Logarithm
The logarithm of a number is the exponent by which another fixed value, the base, has to be raised to produce that number. For example, the logarithm of 1000 to base 10 is 3, because 1000 is 10 to the power 3: More generally, if x = by, then y is the logarithm of x to base b, and is written...
ic density to compute higher values, resulting in the same
 efficiency, but with lower memory requirements.
Estimation
For a discreteDiscrete
Discrete in science is the opposite of continuous: something that is separate; distinct; individual.Discrete may refer to:*Discrete particle or quantum in physics, for example in quantum theory...
process of length
 defined as
  with known mean and variance, an estimate of the autocorrelation may be obtained as
for any positive integer
 . When the true mean
  and variance
  are known, this estimate is unbiased. If the true mean and variance of the process are not known there are a several possibilities:
- If
 and
and  are replaced by the standard formulae for sample mean and sample variance, then this is a biased estimate.
 - A periodogramPeriodogramThe periodogram is an estimate of the spectral density of a signal. The term was coined by Arthur Schuster in 1898 as in the following quote:...
-based estimate replaces in the above formula with
  . This estimate is always biased; however, it usually has a smaller mean square error.
 - Other possibilities derive from treating the two portions of data
 and
and  separately and calculating separate sample means and/or sample variances for use in defining the estimate.
The advantage of estimates of the last type is that the set of estimated autocorrelations, as a function of
 , then form a function which is a valid autocorrelation in the sense that it is possible to define a theoretical process having exactly that autocorrelation. Other estimates can suffer from the problem that, if they are used to calculate the variance of a linear combination of the
  's, the variance calculated may turn out to be negative.
 Regression analysis
In regression analysisRegression analysis
In statistics, regression analysis includes many techniques for modeling and analyzing several variables, when the focus is on the relationship between a dependent variable and one or more independent variables...
using time series data, autocorrelation of the errors is a problem. Autocorrelation of the errors, which themselves are unobserved, can generally be detected because it produces autocorrelation in the observable residuals
Errors and residuals in statistics
In statistics and optimization, statistical errors and residuals are two closely related and easily confused measures of the deviation of a sample from its "theoretical value"...
. (Errors are also known as "error terms" in econometrics
Econometrics
Econometrics has been defined as "the application of mathematics and statistical methods to economic data" and described as the branch of economics "that aims to give empirical content to economic relations." More precisely, it is "the quantitative analysis of actual economic phenomena based on...
.)
Autocorrelation violates the ordinary least squares (OLS) assumption that the error terms are uncorrelated. While it does not bias the OLS coefficient estimates, the standard errors
Standard error (statistics)
The standard error is the standard deviation of the sampling distribution of a statistic. The term may also be used to refer to an estimate of that standard deviation, derived from a particular sample used to compute the estimate....
tend to be underestimated (and the t-scores overestimated) when the autocorrelations of the errors at low lags are positive.
The traditional test for the presence of first-order autocorrelation is the Durbin–Watson statistic or, if the explanatory variables include a lagged dependent variable, Durbin's h statistic. A more flexible test, covering autocorrelation of higher orders and applicable whether or not the regressors include lags of the dependent variable, is the Breusch–Godfrey test
Breusch–Godfrey test
In statistics, the Breusch–Godfrey test is used to assess the validity of some of the modelling assumptions inherent in applying regression-like models to observed data series...
. This involves an auxiliary regression, wherein the residuals obtained from estimating the model of interest are regressed on (a) the original regressors and (b) k lags of the residuals, where k is the order of the test. The simplest version of the test statistic from this
auxiliary regression is TR2, where T is the sample size and R2 is the coefficient of determination
Coefficient of determination
In statistics, the coefficient of determination R2 is used in the context of statistical models whose main purpose is the prediction of future outcomes on the basis of other related information. It is the proportion of variability in a data set that is accounted for by the statistical model...
. Under the null hypothesis of no autocorrelation, this statistic is
asymptotically distributed as
 with k degrees of freedom.
Responses to nonzero autocorrelation include generalized least squares
Generalized least squares
In statistics, generalized least squares is a technique for estimating the unknown parameters in a linear regression model. The GLS is applied when the variances of the observations are unequal , or when there is a certain degree of correlation between the observations...
and the Newey–West HAC estimator (Heteroskedasticity and Autocorrelation Consistent).
Applications
- One application of autocorrelation is the measurement of optical spectra and the measurement of very-short-duration lightLightLight or visible light is electromagnetic radiation that is visible to the human eye, and is responsible for the sense of sight. Visible light has wavelength in a range from about 380 nanometres to about 740 nm, with a frequency range of about 405 THz to 790 THz...
pulsesUltrashort pulseIn optics, an ultrashort pulse of light is an electromagnetic pulse whose time duration is of the order of a femtosecond . Such pulses have a broadband optical spectrum, and can be created by mode-locked oscillators...
produced by laserLaserA laser is a device that emits light through a process of optical amplification based on the stimulated emission of photons. The term "laser" originated as an acronym for Light Amplification by Stimulated Emission of Radiation...
s, both using optical autocorrelatorsOptical autocorrelationIn optics, various autocorrelation functions can be experimentally realized. The field autocorrelation may be used to calculate the spectrum of a source of light, while the intensity autocorrelation and the interferometric autocorrelation are commonly used to estimate the duration of ultrashort...
.
- For measuring particle size distributionParticle size distributionThe particle-size distribution of a powder, or granular material, or particles dispersed in fluid, is a list of values or a mathematical function that defines the relative amounts of particles present, sorted according to size...
s of very fine particles or micelleMicelleA micelle is an aggregate of surfactant molecules dispersed in a liquid colloid. A typical micelle in aqueous solution forms an aggregate with the hydrophilic "head" regions in contact with surrounding solvent, sequestering the hydrophobic single tail regions in the micelle centre. This phase is...
s suspended in a fluid. A laser shining into the mixture produces flicker, which correlates with the motion of the particles. Autocorrelation of the signal gives a picture of the diffusion speeds of the particles. From this, knowing the viscosity of the fluid, the sizes of the particles can be calculated.
- In optics, normalized autocorrelations and cross-correlations give the degree of coherence of an electromagnetic field.
- In signal processingSignal processingSignal processing is an area of systems engineering, electrical engineering and applied mathematics that deals with operations on or analysis of signals, in either discrete or continuous time...
, autocorrelation can give information about repeating events like musicMusicMusic is an art form whose medium is sound and silence. Its common elements are pitch , rhythm , dynamics, and the sonic qualities of timbre and texture...
al beatBeat (music)The beat is the basic unit of time in music, the pulse of the mensural level . In popular use, the beat can refer to a variety of related concepts including: tempo, meter, rhythm and groove...
s (for example, to determine tempoTempoIn musical terminology, tempo is the speed or pace of a given piece. Tempo is a crucial element of any musical composition, as it can affect the mood and difficulty of a piece.-Measuring tempo:...
) or pulsarPulsarA pulsar is a highly magnetized, rotating neutron star that emits a beam of electromagnetic radiation. The radiation can only be observed when the beam of emission is pointing towards the Earth. This is called the lighthouse effect and gives rise to the pulsed nature that gives pulsars their name...
frequenciesFrequencyFrequency is the number of occurrences of a repeating event per unit time. It is also referred to as temporal frequency.The period is the duration of one cycle in a repeating event, so the period is the reciprocal of the frequency...
, though it cannot tell the position in time of the beat. It can also be used to estimate the pitch of a musical tonePitch detection algorithmA pitch detection algorithm is an algorithm designed to estimate the pitch or fundamental frequency of a quasiperiodic or virtually periodic signal, usually a digital recording of speech or a musical note or tone. This can be done in the time domain or the frequency domain.PDAs are used in various...
.
- In music recording, autocorrelation is used as a pitch detection algorithmPitch detection algorithmA pitch detection algorithm is an algorithm designed to estimate the pitch or fundamental frequency of a quasiperiodic or virtually periodic signal, usually a digital recording of speech or a musical note or tone. This can be done in the time domain or the frequency domain.PDAs are used in various...
prior to vocal processing, as a distortion effect or to eliminate undesired mistakes and inaccuracies.
- Autocorrelation in space rather than time, via the Patterson functionPatterson functionThe Patterson function is used to solve the phase problem in X-ray crystallography. It was introduced in 1935 by Arthur Lindo Patterson while he was a visiting researcher in the laboratory of Bertram Eugene Warren at MIT....
, is used by X-ray diffractionists to help recover the "Fourier phase information" on atom positions not available through diffraction alone.
- In statistics, spatial autocorrelation between sample locations also helps one estimate mean value uncertainties when sampling a heterogeneous population.
- The SEQUESTSEQUESTSEQUEST is a tandem mass spectrometry data analysis program used for protein identification. Sequest identifies collections of tandem mass spectra to peptide sequences that have been generated from databases of protein sequences.-Applications:...
algorithm for analyzing mass spectraMass spectrumA mass spectrum is an intensity vs. m/z plot representing a chemical analysis. Hence, the mass spectrum of a sample is a pattern representing the distribution of ions by mass in a sample. It is a histogram usually acquired using an instrument called a mass spectrometer...
makes use of autocorrelation in conjunction with cross-correlationCross-correlationIn signal processing, cross-correlation is a measure of similarity of two waveforms as a function of a time-lag applied to one of them. This is also known as a sliding dot product or sliding inner-product. It is commonly used for searching a long-duration signal for a shorter, known feature...
to score the similarity of an observed spectrum to an idealized spectrum representing a peptidePeptidePeptides are short polymers of amino acid monomers linked by peptide bonds. They are distinguished from proteins on the basis of size, typically containing less than 50 monomer units. The shortest peptides are dipeptides, consisting of two amino acids joined by a single peptide bond...
. - In AstrophysicsAstrophysicsAstrophysics is the branch of astronomy that deals with the physics of the universe, including the physical properties of celestial objects, as well as their interactions and behavior...
, auto-correlation is used to study and characterize the spatial distribution of galaxies in the Universe and in multi-wavelength observations of Low Mass X-ray Binaries.
- In panel dataPanel dataIn statistics and econometrics, the term panel data refers to multi-dimensional data. Panel data contains observations on multiple phenomena observed over multiple time periods for the same firms or individuals....
, spatial autocorrelation refers to correlation of a variable with itself through space.
See also
- Autocorrelation techniqueAutocorrelation techniqueThe autocorrelation technique is a method for estimating the dominating frequency in a complex signal, as well as its variance. Specifically, it calculates the first two moments of the power spectrum, namely the mean and variance...
- AutocorrelatorAutocorrelatorA real time interferometric autocorrelator is an electronic tool used to examine the autocorrelation of, among other things, optical beam intensity and spectral components through examination of variable beam path differences...
- Correlation functionCorrelation functionA correlation function is the correlation between random variables at two different points in space or time, usually as a function of the spatial or temporal distance between the points...
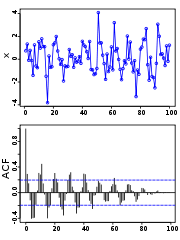
- CorrelogramCorrelogramIn the analysis of data, a correlogram is an image of correlation statistics. For example, in time series analysis, a correlogram, also known as an autocorrelation plot, is a plot of the sample autocorrelations r_h\, versus h\, ....
- Cross-correlationCross-correlationIn signal processing, cross-correlation is a measure of similarity of two waveforms as a function of a time-lag applied to one of them. This is also known as a sliding dot product or sliding inner-product. It is commonly used for searching a long-duration signal for a shorter, known feature...
- Galton's problemGalton's problemGalton’s problem, named after Sir Francis Galton, is the problem of drawing inferences from cross-cultural data, due to the statistical phenomenon now called autocorrelation. The problem is now recognized as a general one that applies to all nonexperimental studies and to experimental design as well...
- Partial autocorrelation functionPartial autocorrelation functionIn time series analysis, the partial autocorrelation function plays an important role in data analyses aimed at identifying the extent of the lag in an autoregressive model...
- Fluorescence correlation spectroscopyFluorescence correlation spectroscopyFluorescence correlation spectroscopy is a correlation analysis of fluctuation of the fluorescence intensity. The analysis provides parameters of the physics under the fluctuations. One of the interesting applications of this is an analysis of the concentration fluctuations of fluorescent...
- Optical autocorrelationOptical autocorrelationIn optics, various autocorrelation functions can be experimentally realized. The field autocorrelation may be used to calculate the spectrum of a source of light, while the intensity autocorrelation and the interferometric autocorrelation are commonly used to estimate the duration of ultrashort...
- Pitch detection algorithmPitch detection algorithmA pitch detection algorithm is an algorithm designed to estimate the pitch or fundamental frequency of a quasiperiodic or virtually periodic signal, usually a digital recording of speech or a musical note or tone. This can be done in the time domain or the frequency domain.PDAs are used in various...
- VarianceVarianceIn probability theory and statistics, the variance is a measure of how far a set of numbers is spread out. It is one of several descriptors of a probability distribution, describing how far the numbers lie from the mean . In particular, the variance is one of the moments of a distribution...
- CUSUMCUSUMIn statistical quality control, the CUSUM is a sequential analysis technique due to E. S. Page of the University of Cambridge. It is typically used for monitoring change detection...
- Cochrane–Orcutt estimation (transformation for autocorrelated error terms)
- Prais–Winsten transformation