

kokleang
Question 1
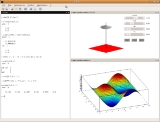
1)By using Scilab to plot the following functions in a graph:
f(x) = x8− 8 x7 + 28 x6− 56 x5 + 70 x4− 56 x3 + 28 x2− 8 x + 1
g(x) = (((((((x − 8) x + 28) x − 56) x + 70) x − 56) x + 28) x − 8) x + 1
h(x) = (x − 1)8
at the points 0.975:0.0001:1.025.
Observe that the three functions are identical mathematically but that the numerical results are quite different. Give your explanation on this discrepancy.
(i already get the graph but i don't know to explain the discrepancy of the graph??)