

Norbert11
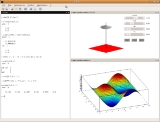
I am using Scilab. I would like to plot 3 graphs (the 2nd graph below the 1st graph and the 3rd graph below the 2nd graph )and to put a colorbar on the right of the 4 plot (instead of having 4 colorbars). How can I do it ? Thanks.